- Daily Chartbook
- Posts
- "That's now a 5-week losing streak for the S&P 500, the 21st since 1970"
"That's now a 5-week losing streak for the S&P 500, the 21st since 1970"
DC Lite #566
Daily Chartbook
March 27, 2026
Welcome back to DC Lite: Daily Chartbook’s free, entry-level newsletter containing 5 of the day’s best charts & insights.
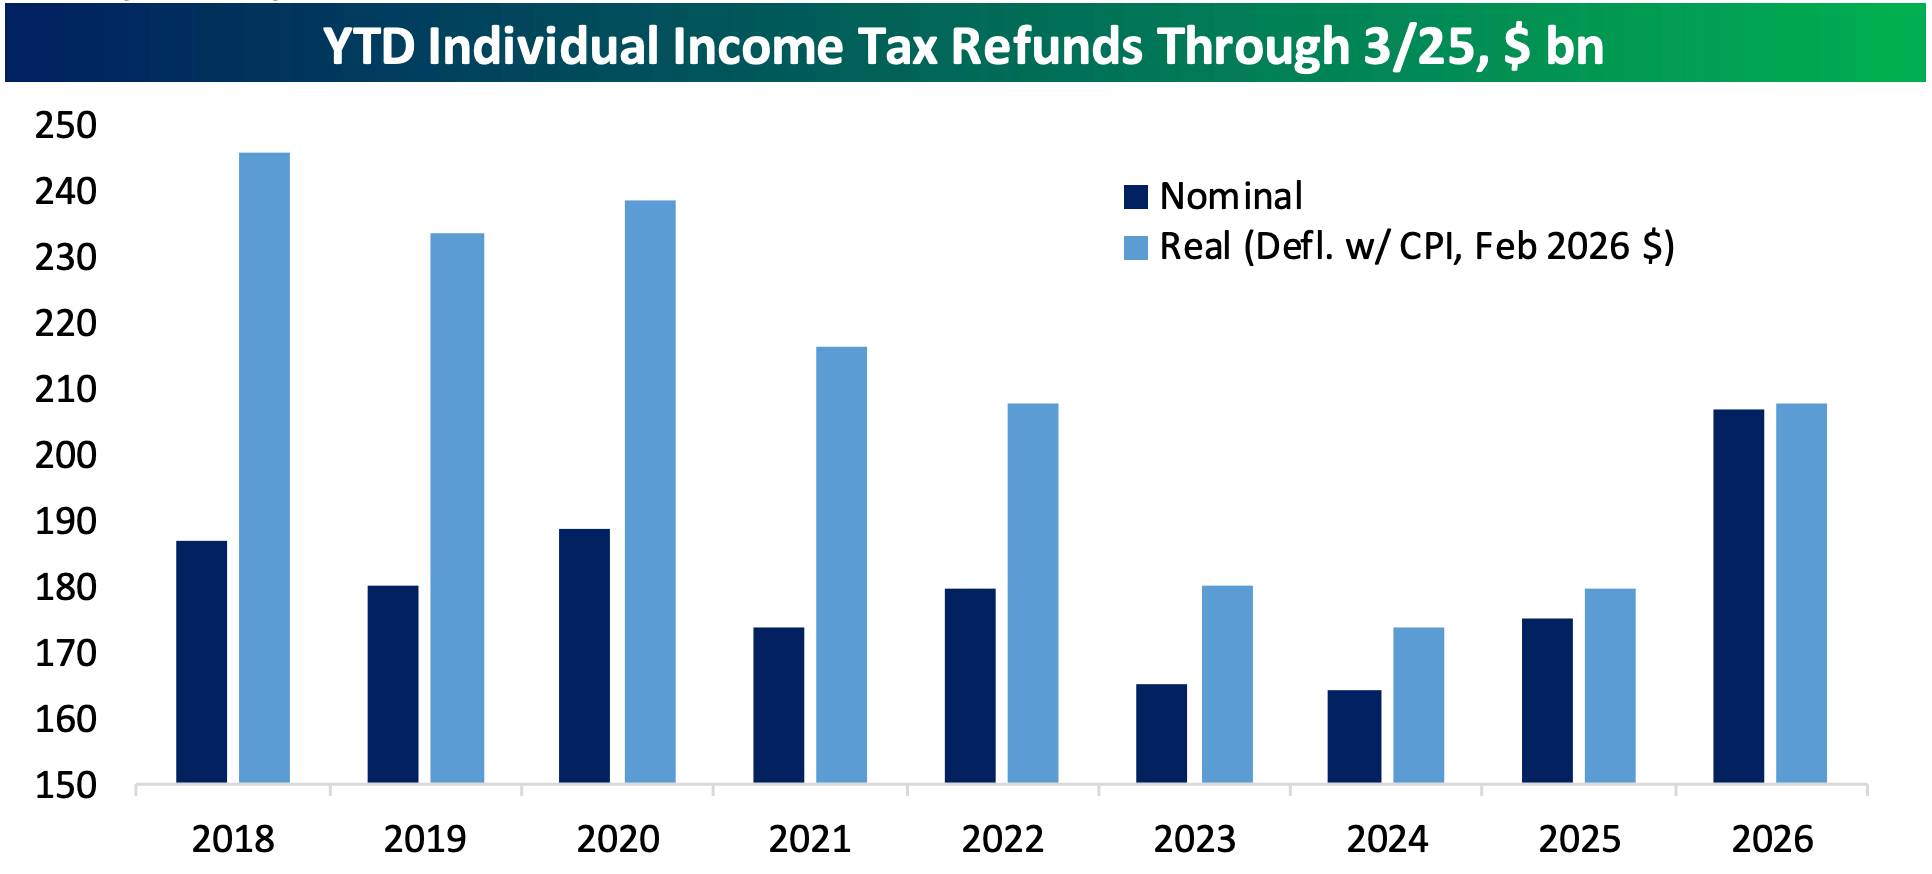
1. Tax refunds. "After accounting for inflation, individual income tax refunds are up about 16% YoY, though the current filing season is far from a record versus prior years: it's the same size as 2022 but significantly smaller than years prior to that."
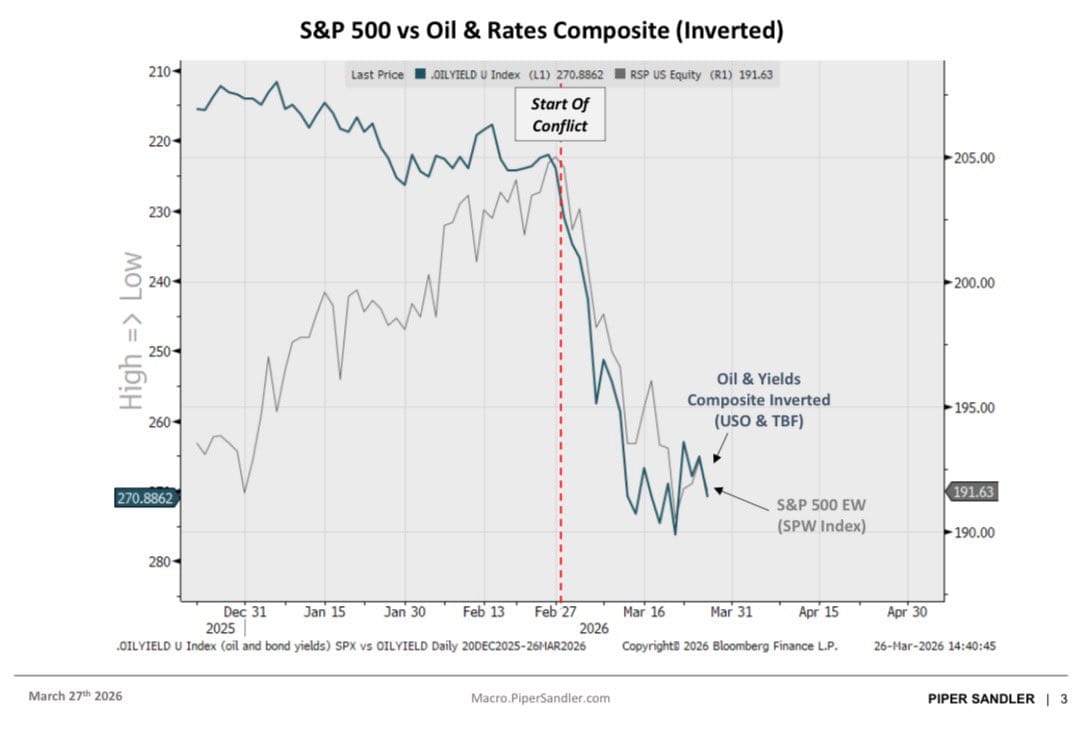
2. Stocks vs. oil. "One-variable markets overwhelm classic market timing metrics like sentiment, technicals and valuation which are more useful in 'normal' times. A composite of oil and rates (oil is driving rates too) tells you all you need to know about the direction of stocks. E.g., If oil continues to rise, oversold indicators will be overwhelmed ... While it's a very complex backdrop, the market outlook has ironically become more simplified. Stocks = [-Oil]."
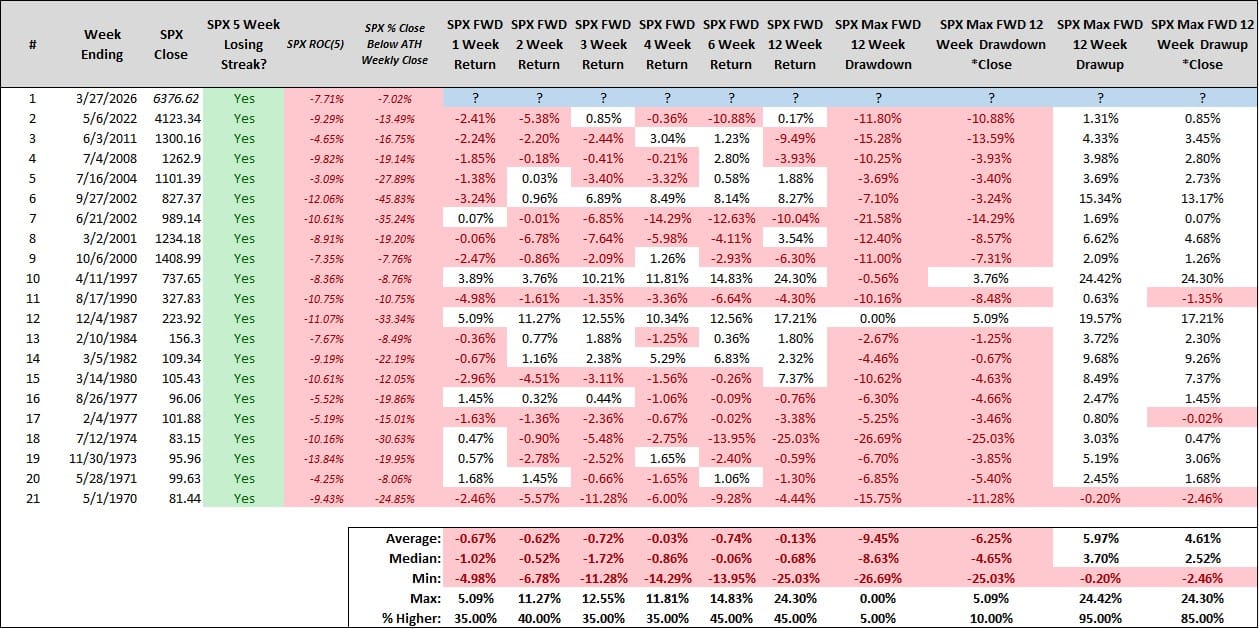
3. SPX streak. "That's now a 5-week losing streak for the S&P 500, the 21st since 1970, which I think most would believe precede really strong market climates over the near term most of the time. But that belief would be 'just a bit outside!'."
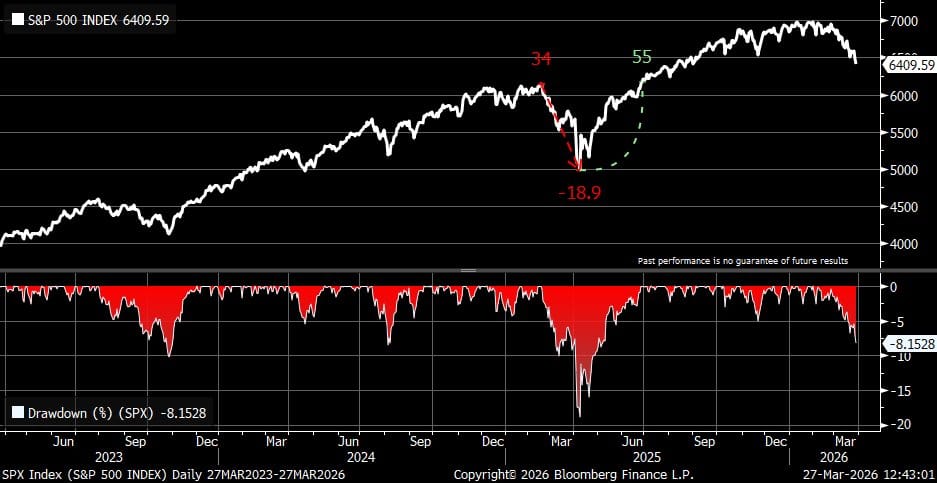
4. Selloff duration. "I think one reason many folks are frustrated with this selloff is because it isn't as sharp and 'buy the dip-like' as last year's. The one last year lasted 34 days. The current drop is already 42 days old, but the % decline is (so far) just less than half of last year's."
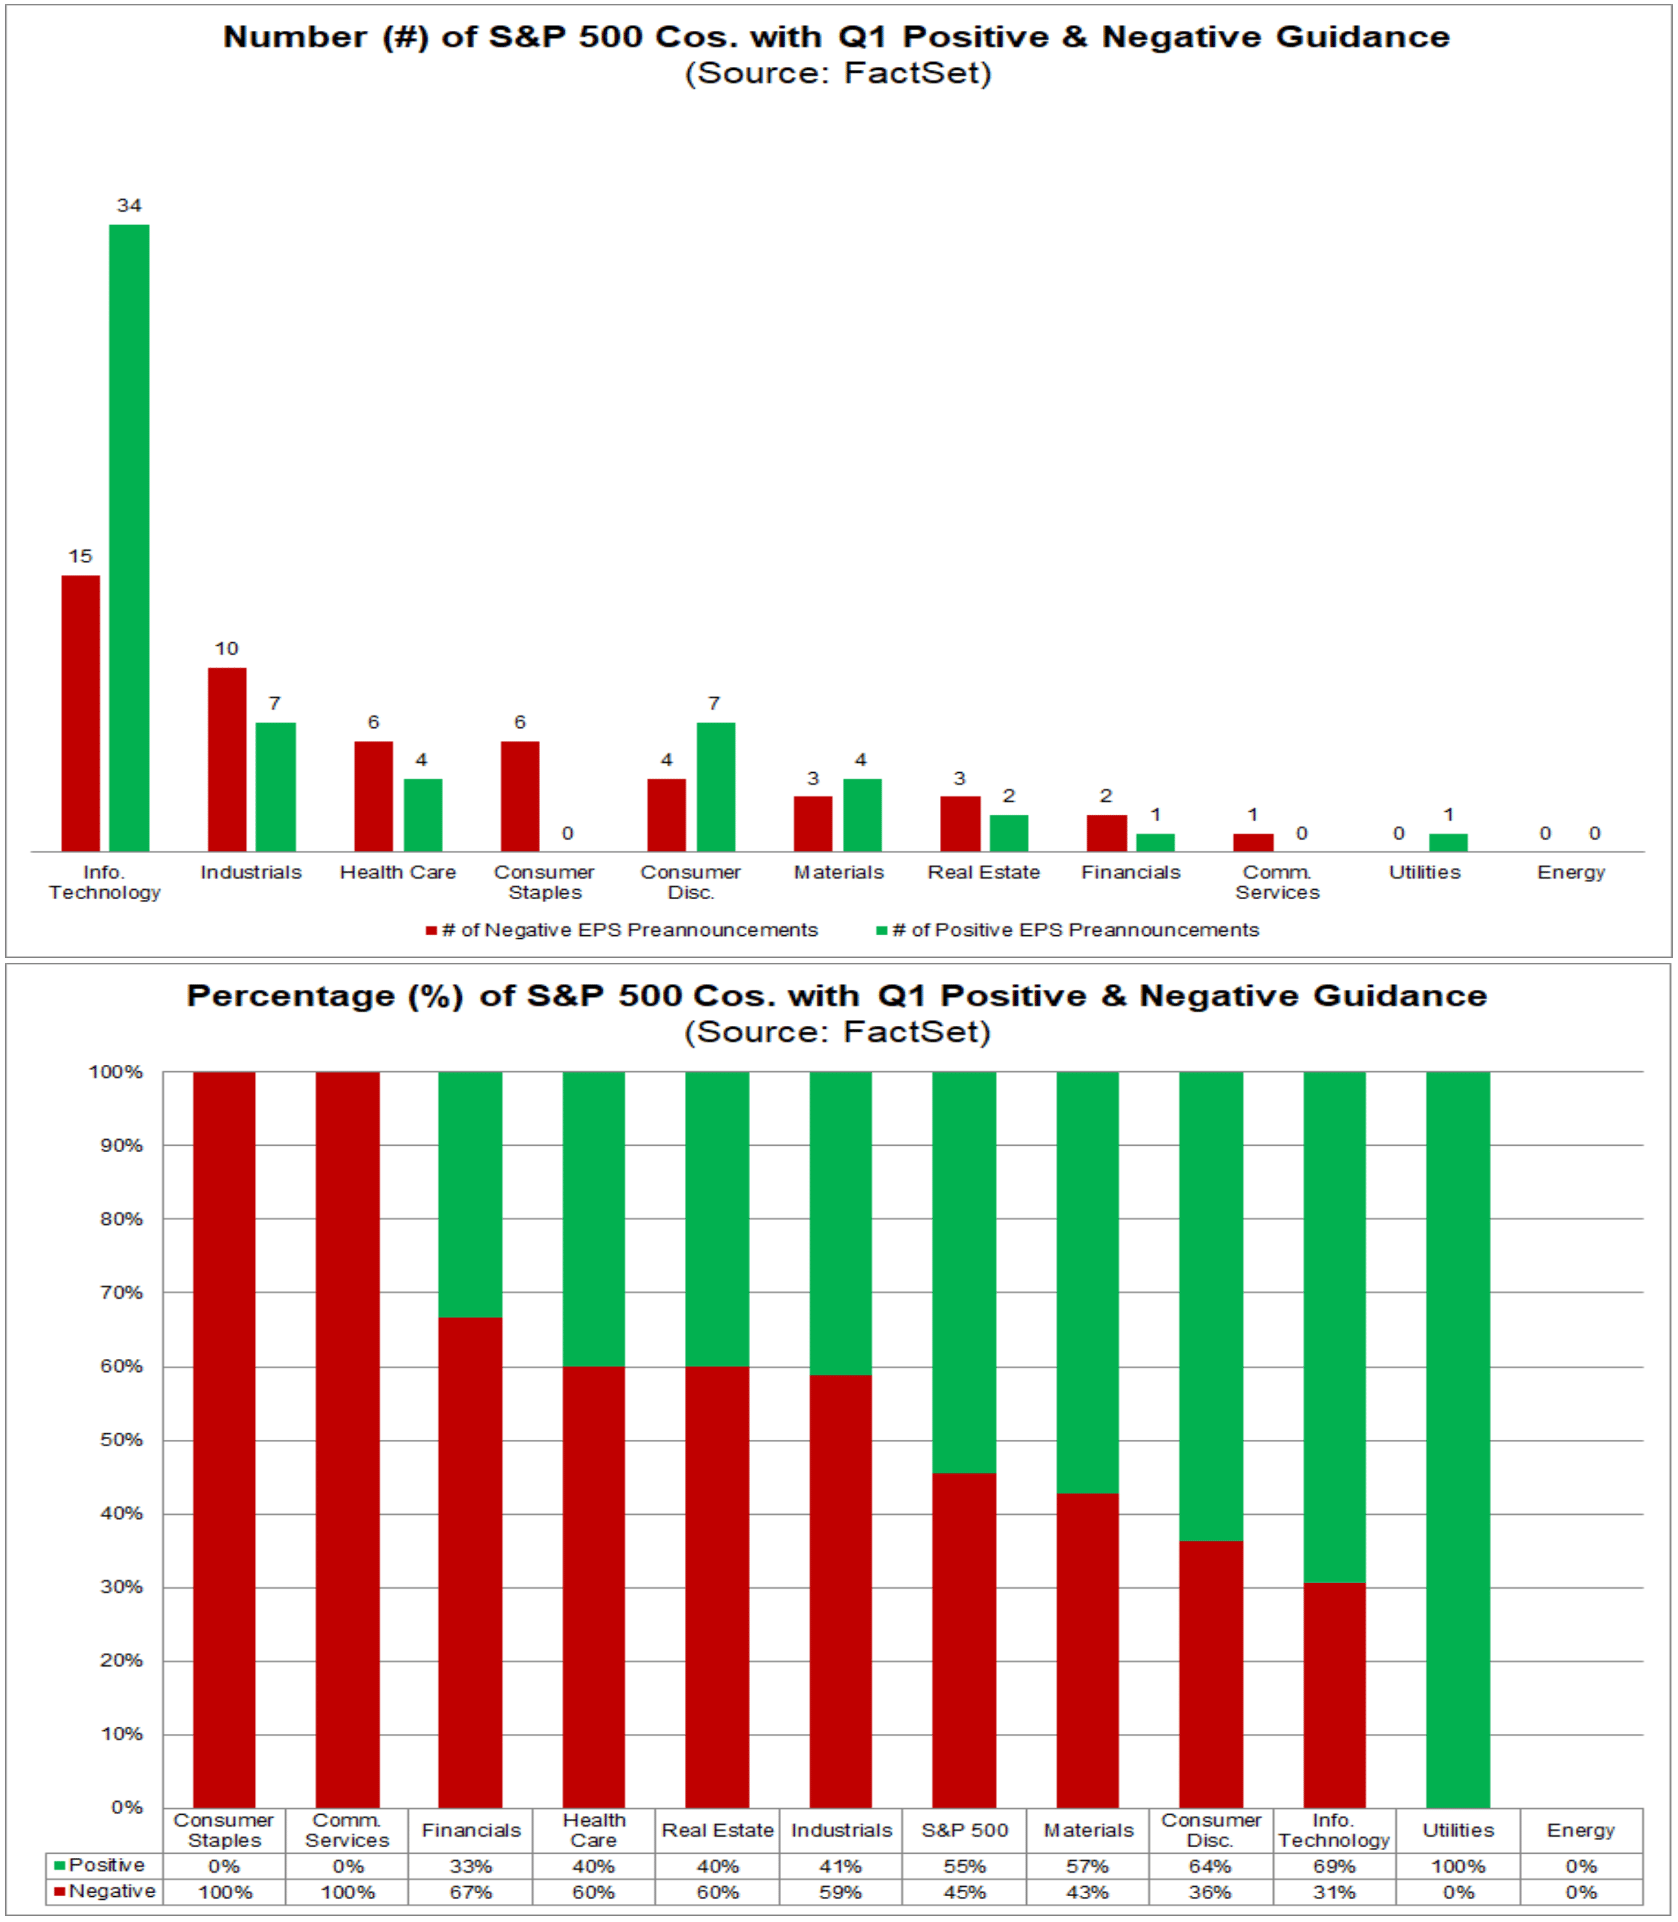
5. Earnings guidance. S&P 500 companies remain optimistic on earnings. Of the 110 that issued EPS guidance for Q1, 60 issued positive guidance. This is well above the 5-year average (44) and 10-year average (40).


Reply