- Daily Chartbook
- Posts
- DC Lite #530
Welcome back to DC Lite: Daily Chartbook’s free, entry-level newsletter containing 5 of the day’s best charts & insights.
1. ISM Services PMI. “US service providers registered the strongest back-to-back growth since 2024 last month as business activity picked up ... While a pickup in business activity underpinned the overall measure, orders growth cooled and employment barely expanded.”

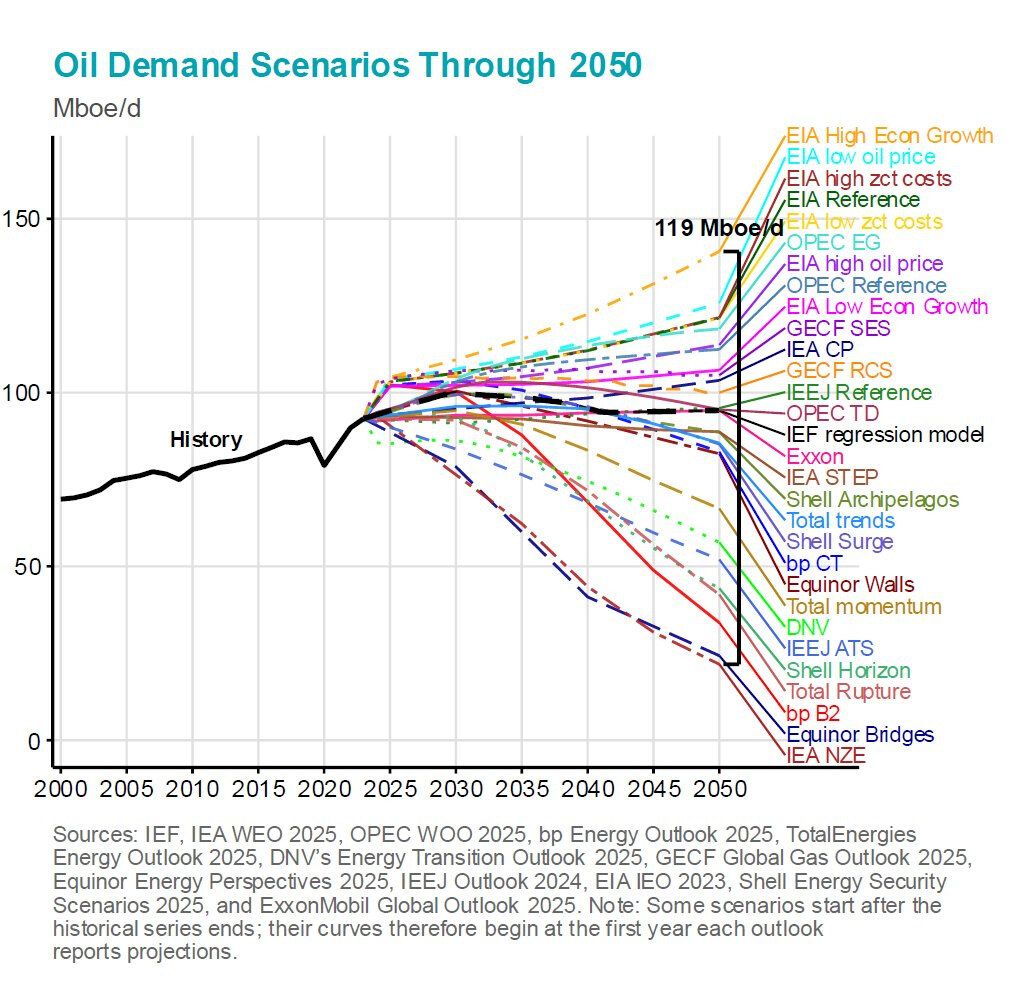
2. Oil demand scenarios. “By 2050, the world will be consuming lots of oil - or almost nothing. The annual [IEF] review of all the major energy scenarios shows that the high and low points for oil demand in 20250 are apart by ~119m b/d, more than today’s consumption.”
3. YTD return buckets. “If you look all the way to the right, in decile 10, that is the highest ‘return bucket’ ... if you look all the way to the left, in decile 1, that is the lowest ‘return bucket’ ... The takeaway of the chart is clear: companies within the Energy, Materials, Staples, and Industrials sectors are are crushing it while companies in Comm Services and Financials are lagging.”

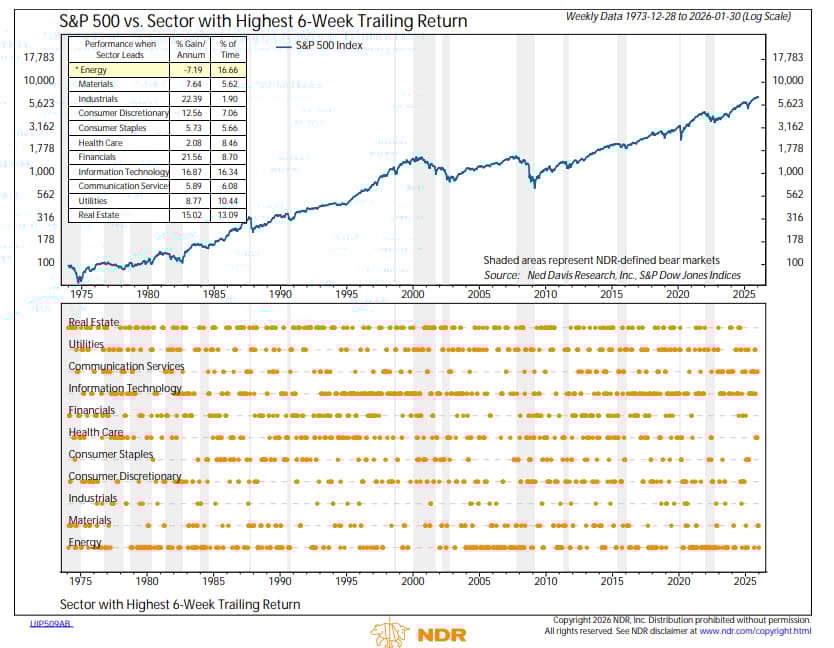
4. SPX vs. leadership. “Cyclical leadership is usually a positive for stock market returns; however, Energy leadership has been the exception. The S&P 500 has fallen at a greater than 7% annualize pace when Energy has been the top-performing sector, on average.”
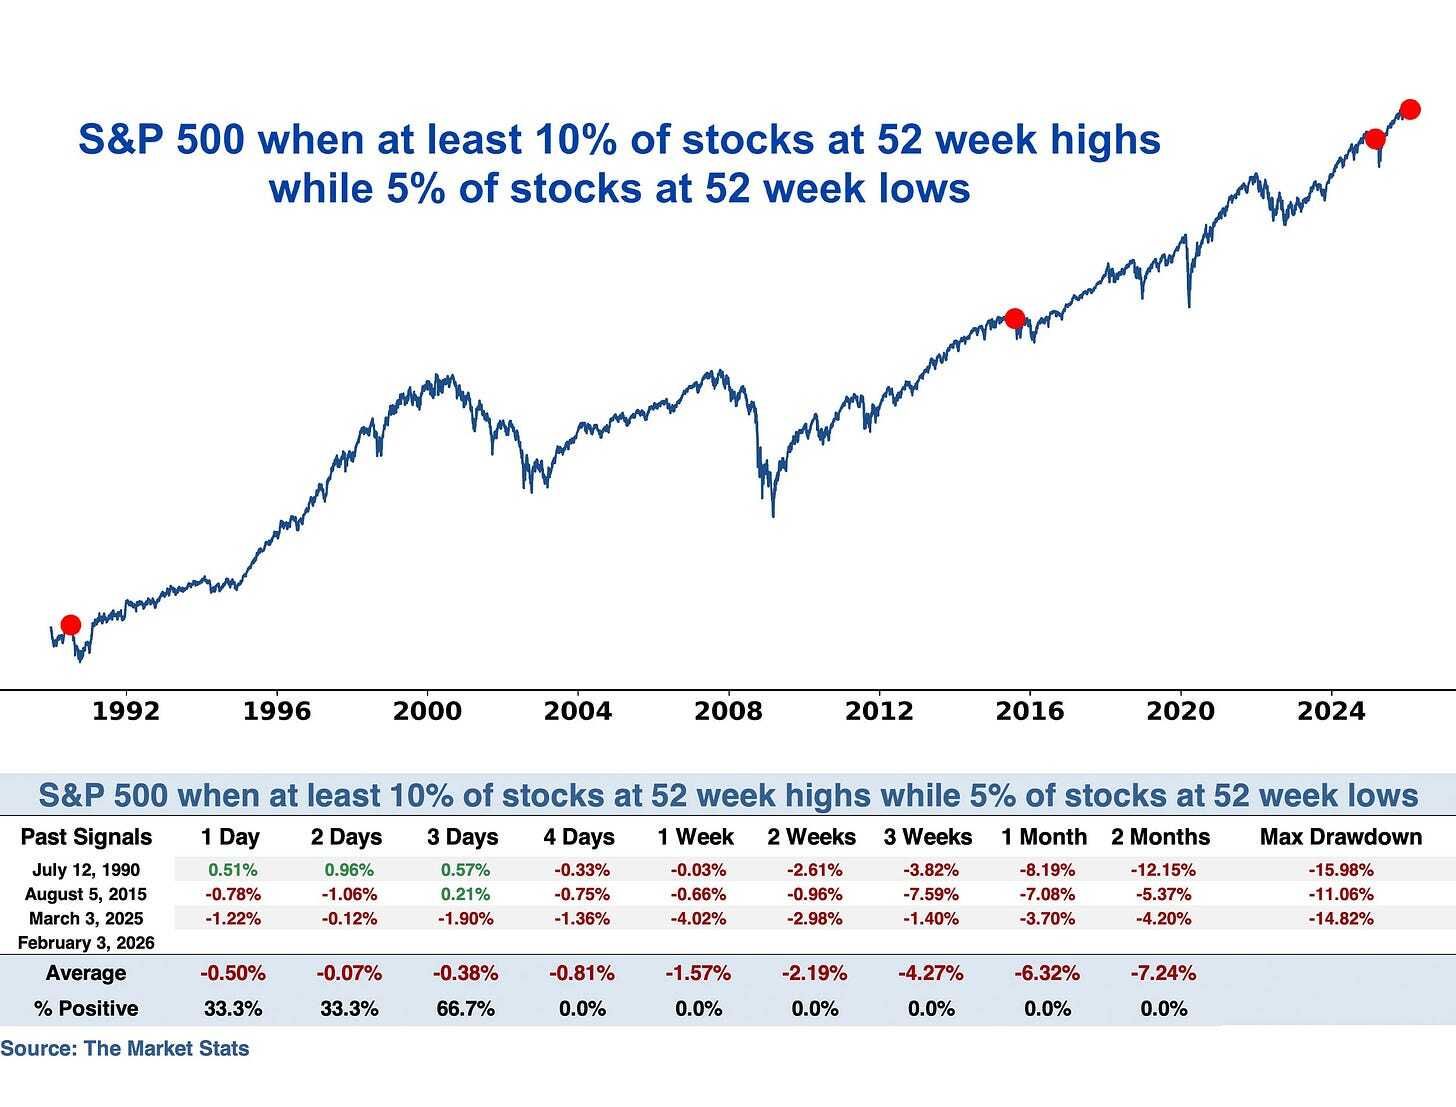
5. Highs vs. lows. “This is a very split market. 16% of S&P 500 stocks are at 52 week highs while 5% are at 52 week lows. This only happened 3 other times: July 1990, August 2015, March 2025. Each were followed by at least a -10% $SPX correction in the next 2 months”.


Reply