- Daily Chartbook
- Posts
- "The last 10-days have been unlike any 10-day period in the market since 1950"
"The last 10-days have been unlike any 10-day period in the market since 1950"
DC Lite #578
Daily Chartbook
April 15, 2026
Welcome back to DC Lite: Daily Chartbook’s free, entry-level newsletter containing 5 of the day’s best charts & insights.
1. Gold vs. liquidity. "Gold is now trading back in line against global money supply growth."

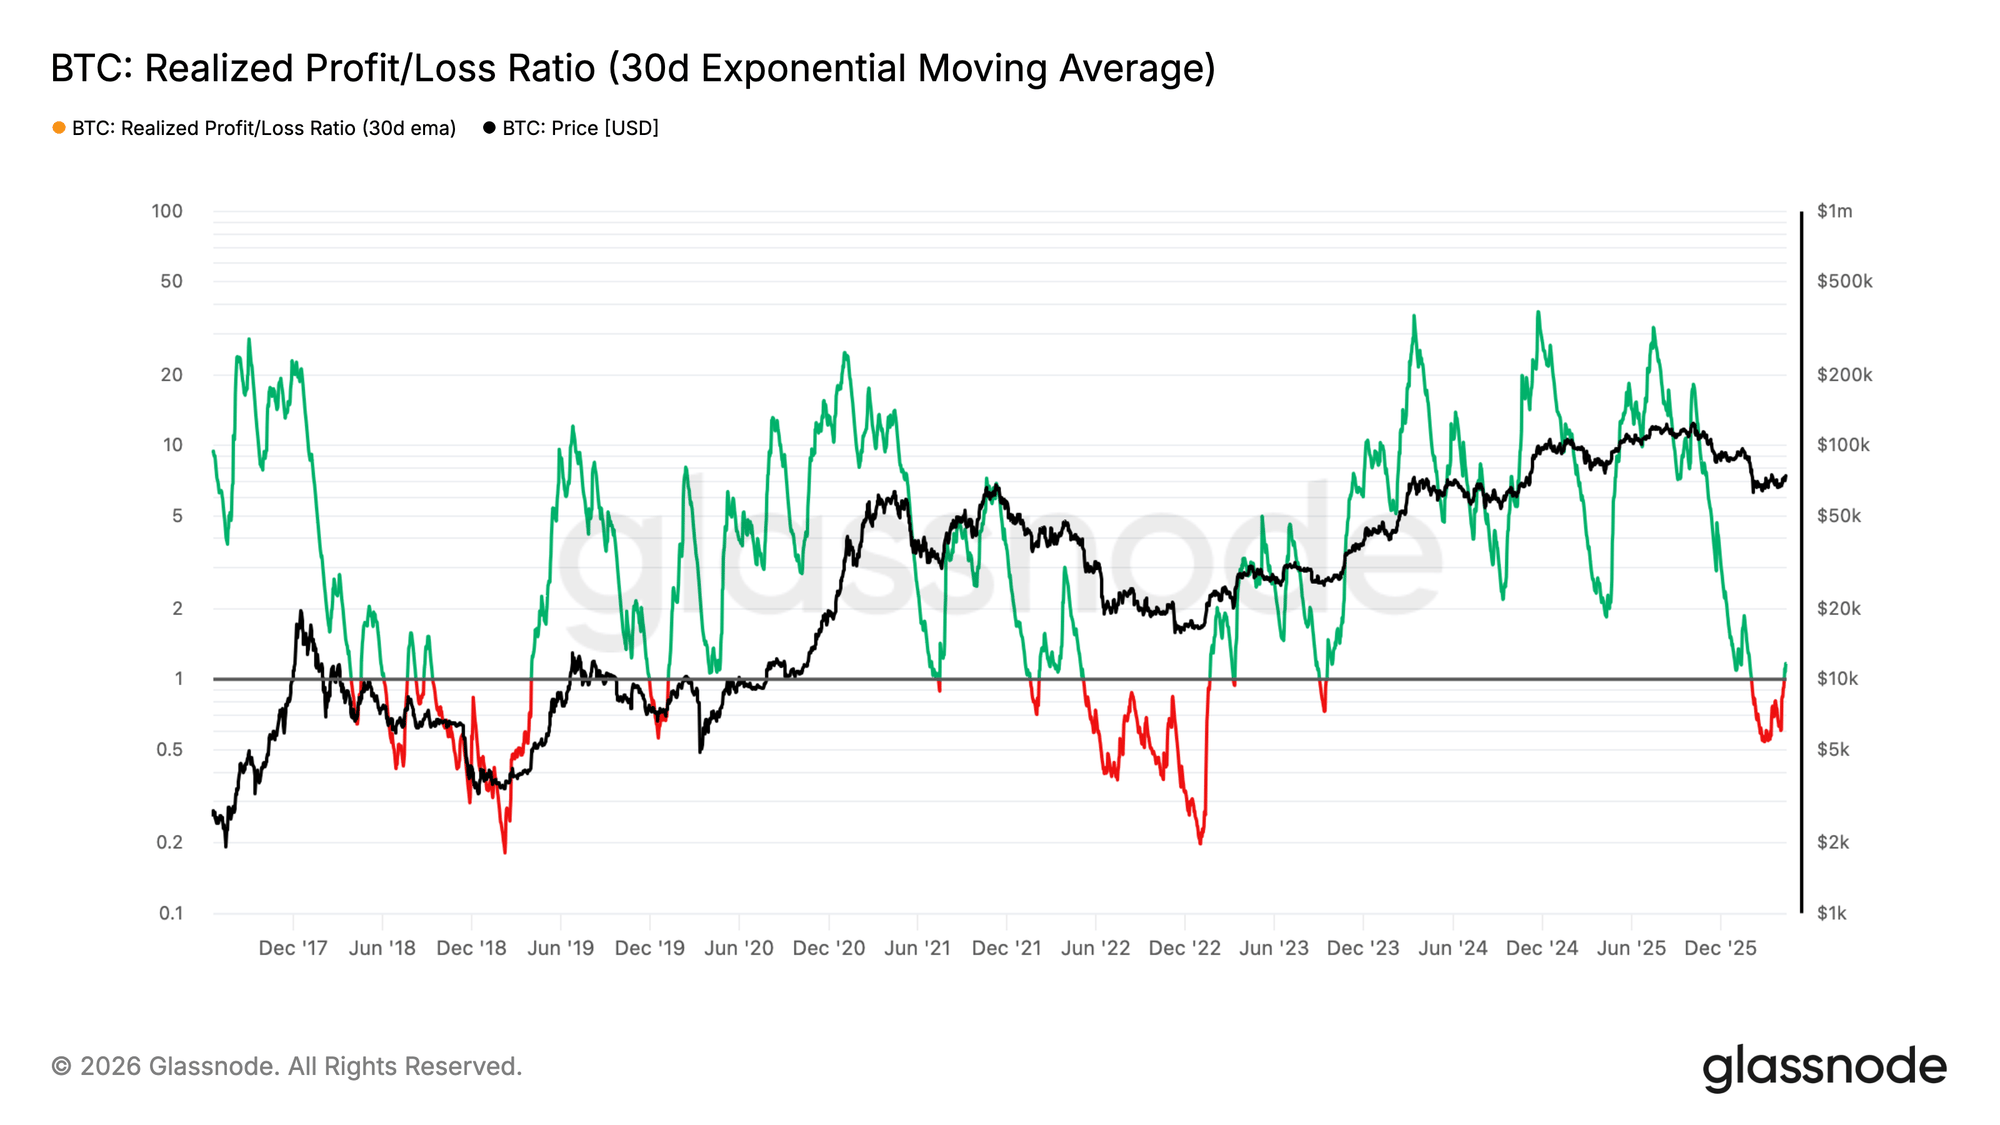
2. BTC realized profit/loss ratio. "A reading above 1 indicates that profit-taking is dominating loss realization. Therefore, the current reading of 1.16 confirms that investors are broadly seizing the present rally as an opportunity to exit positions at breakeven or capture thin profit margins."
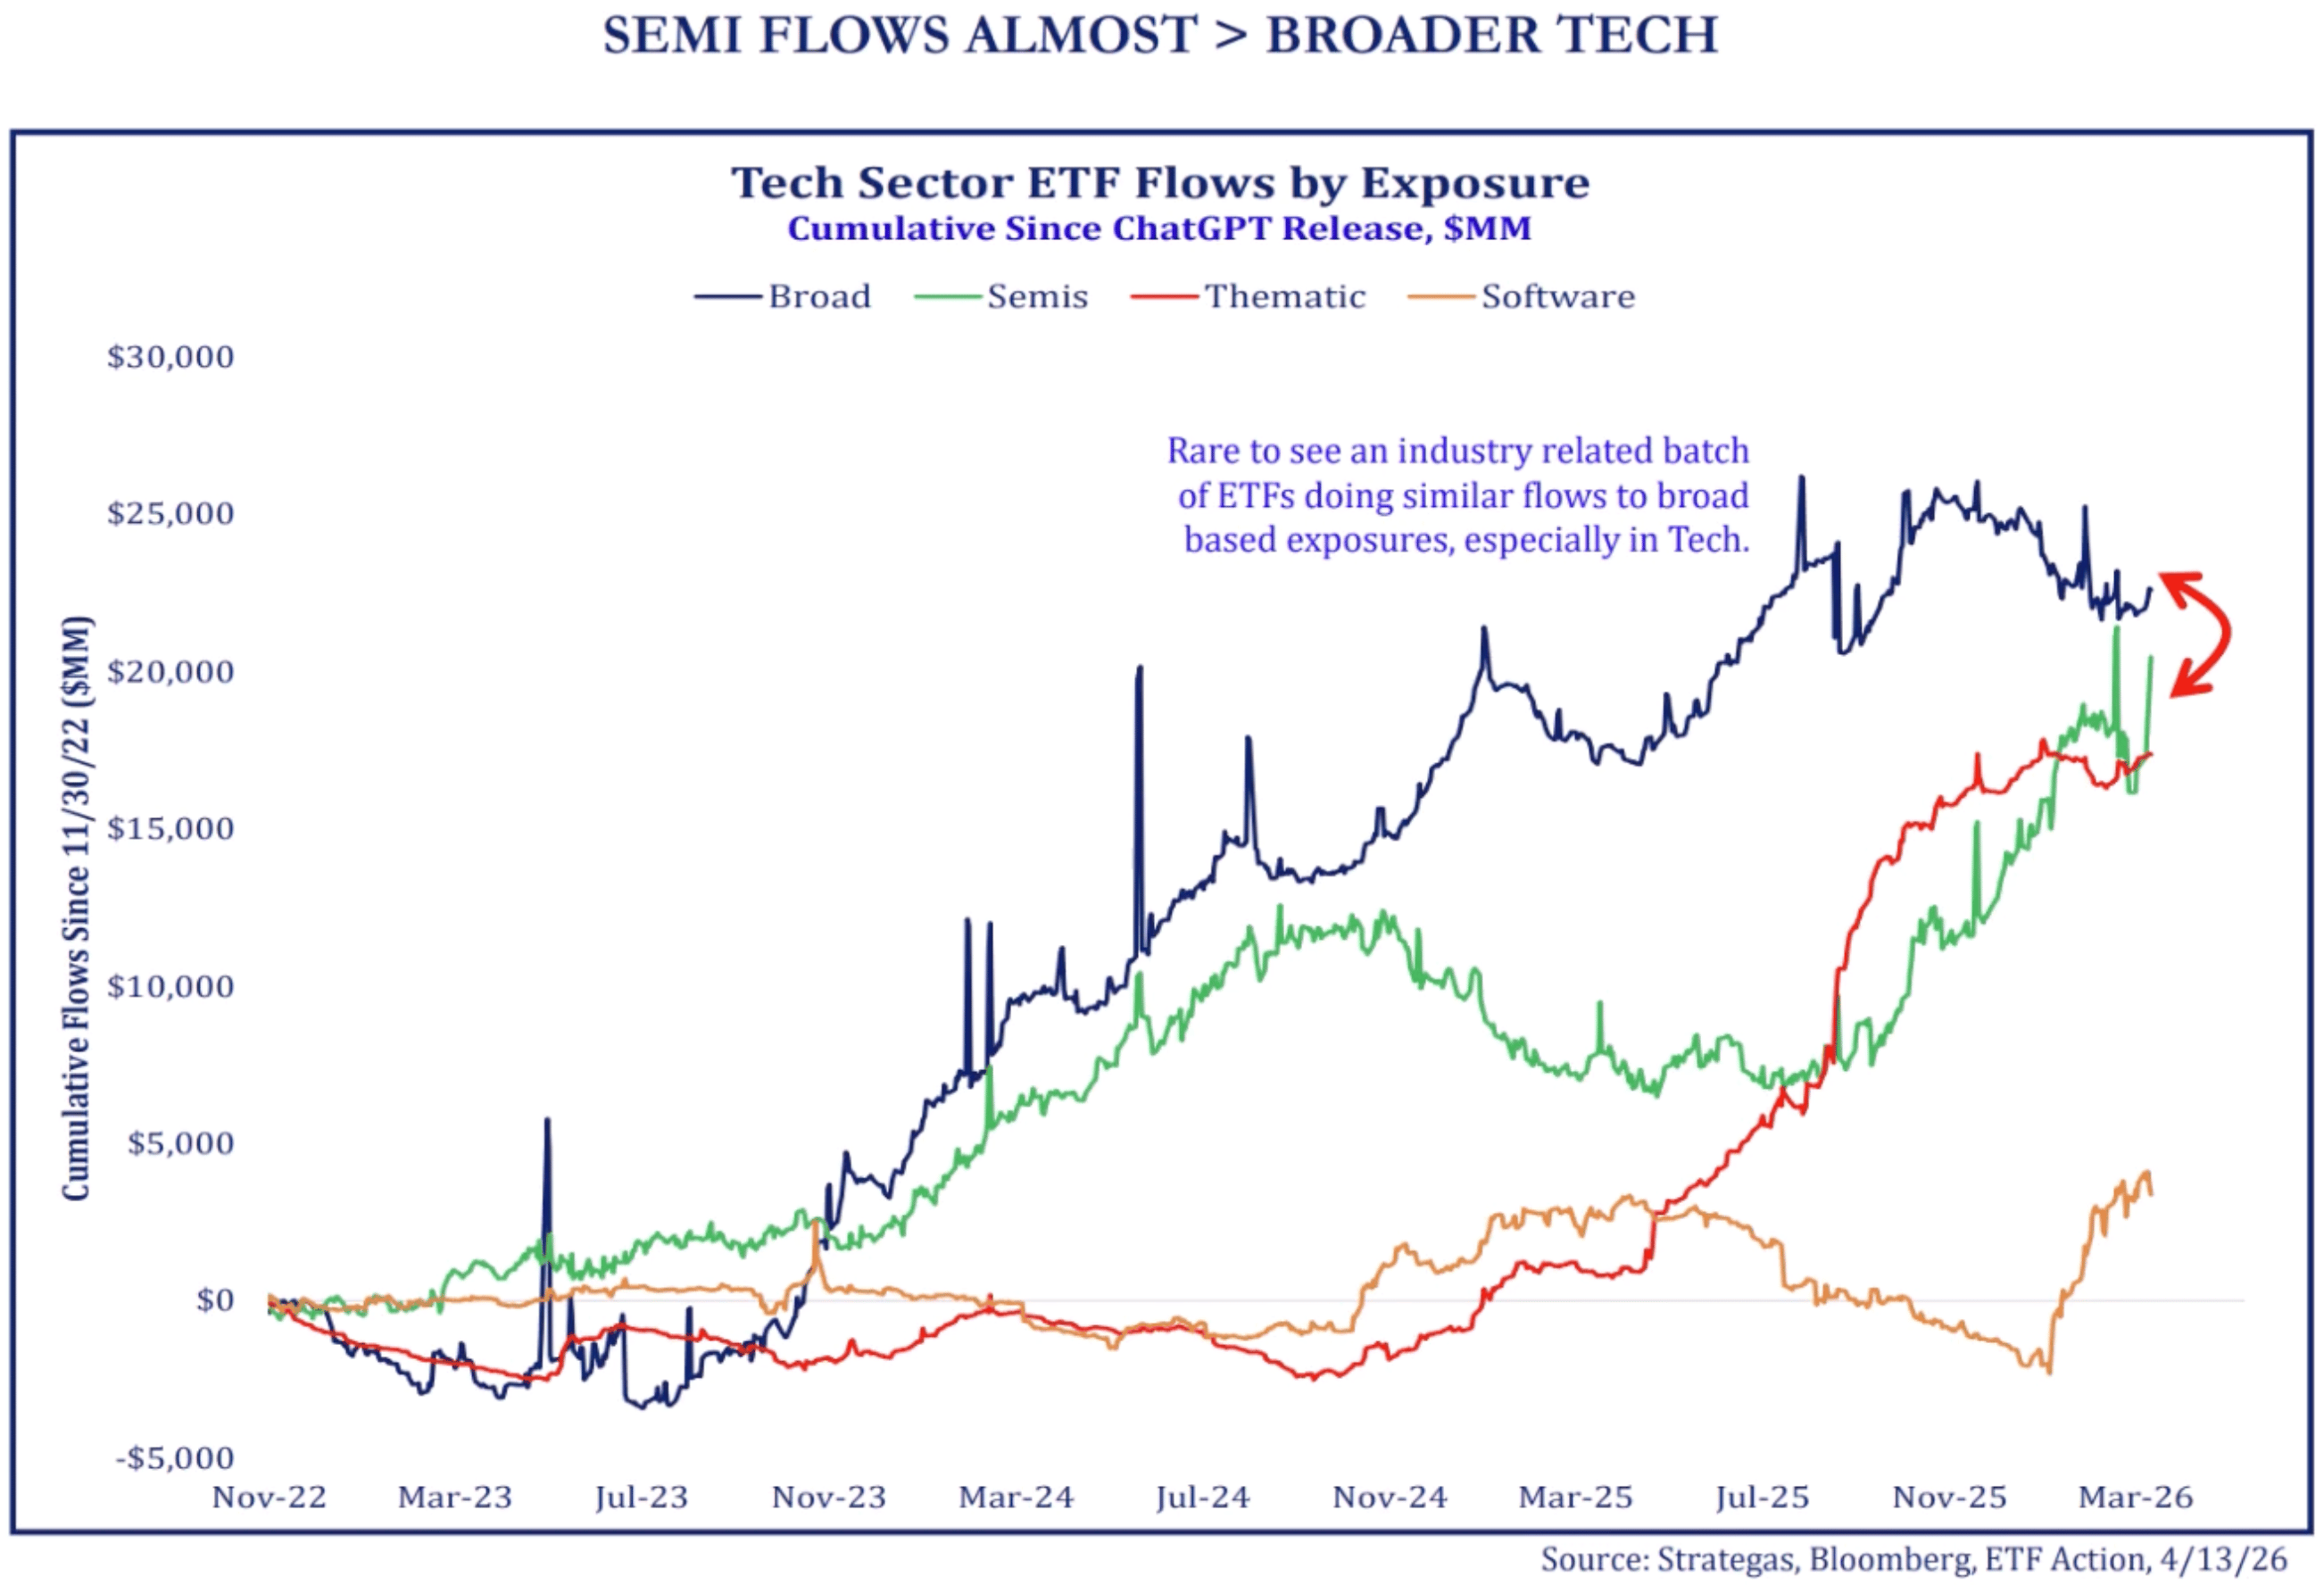
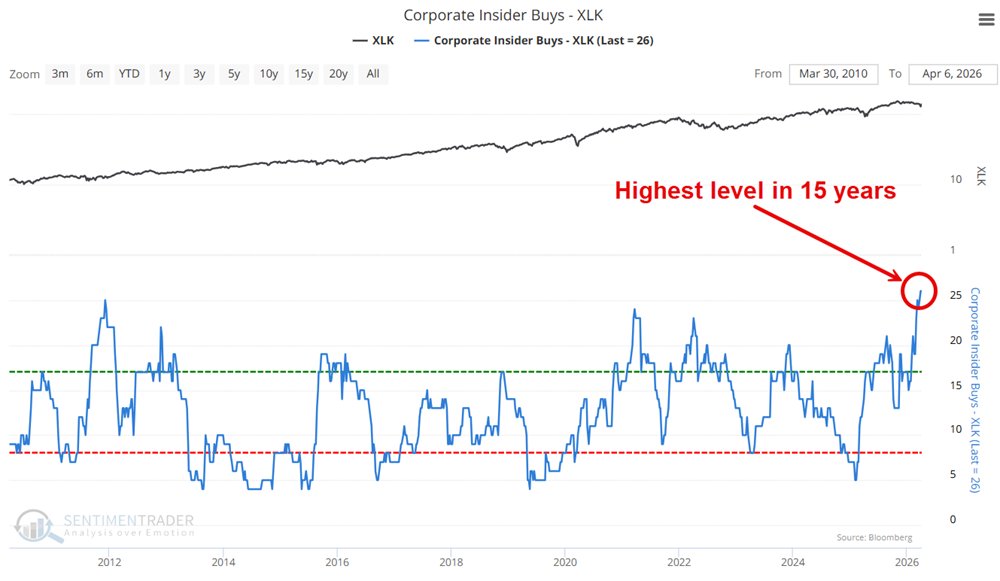
3. Tech sector ETF flows. "Chart shows you Tech sector ETF flows by different exposures since ChatGPT's release roughly 3 years ago ... this is pretty rare, to see an industry group overtake the broader sector exposure in our work."
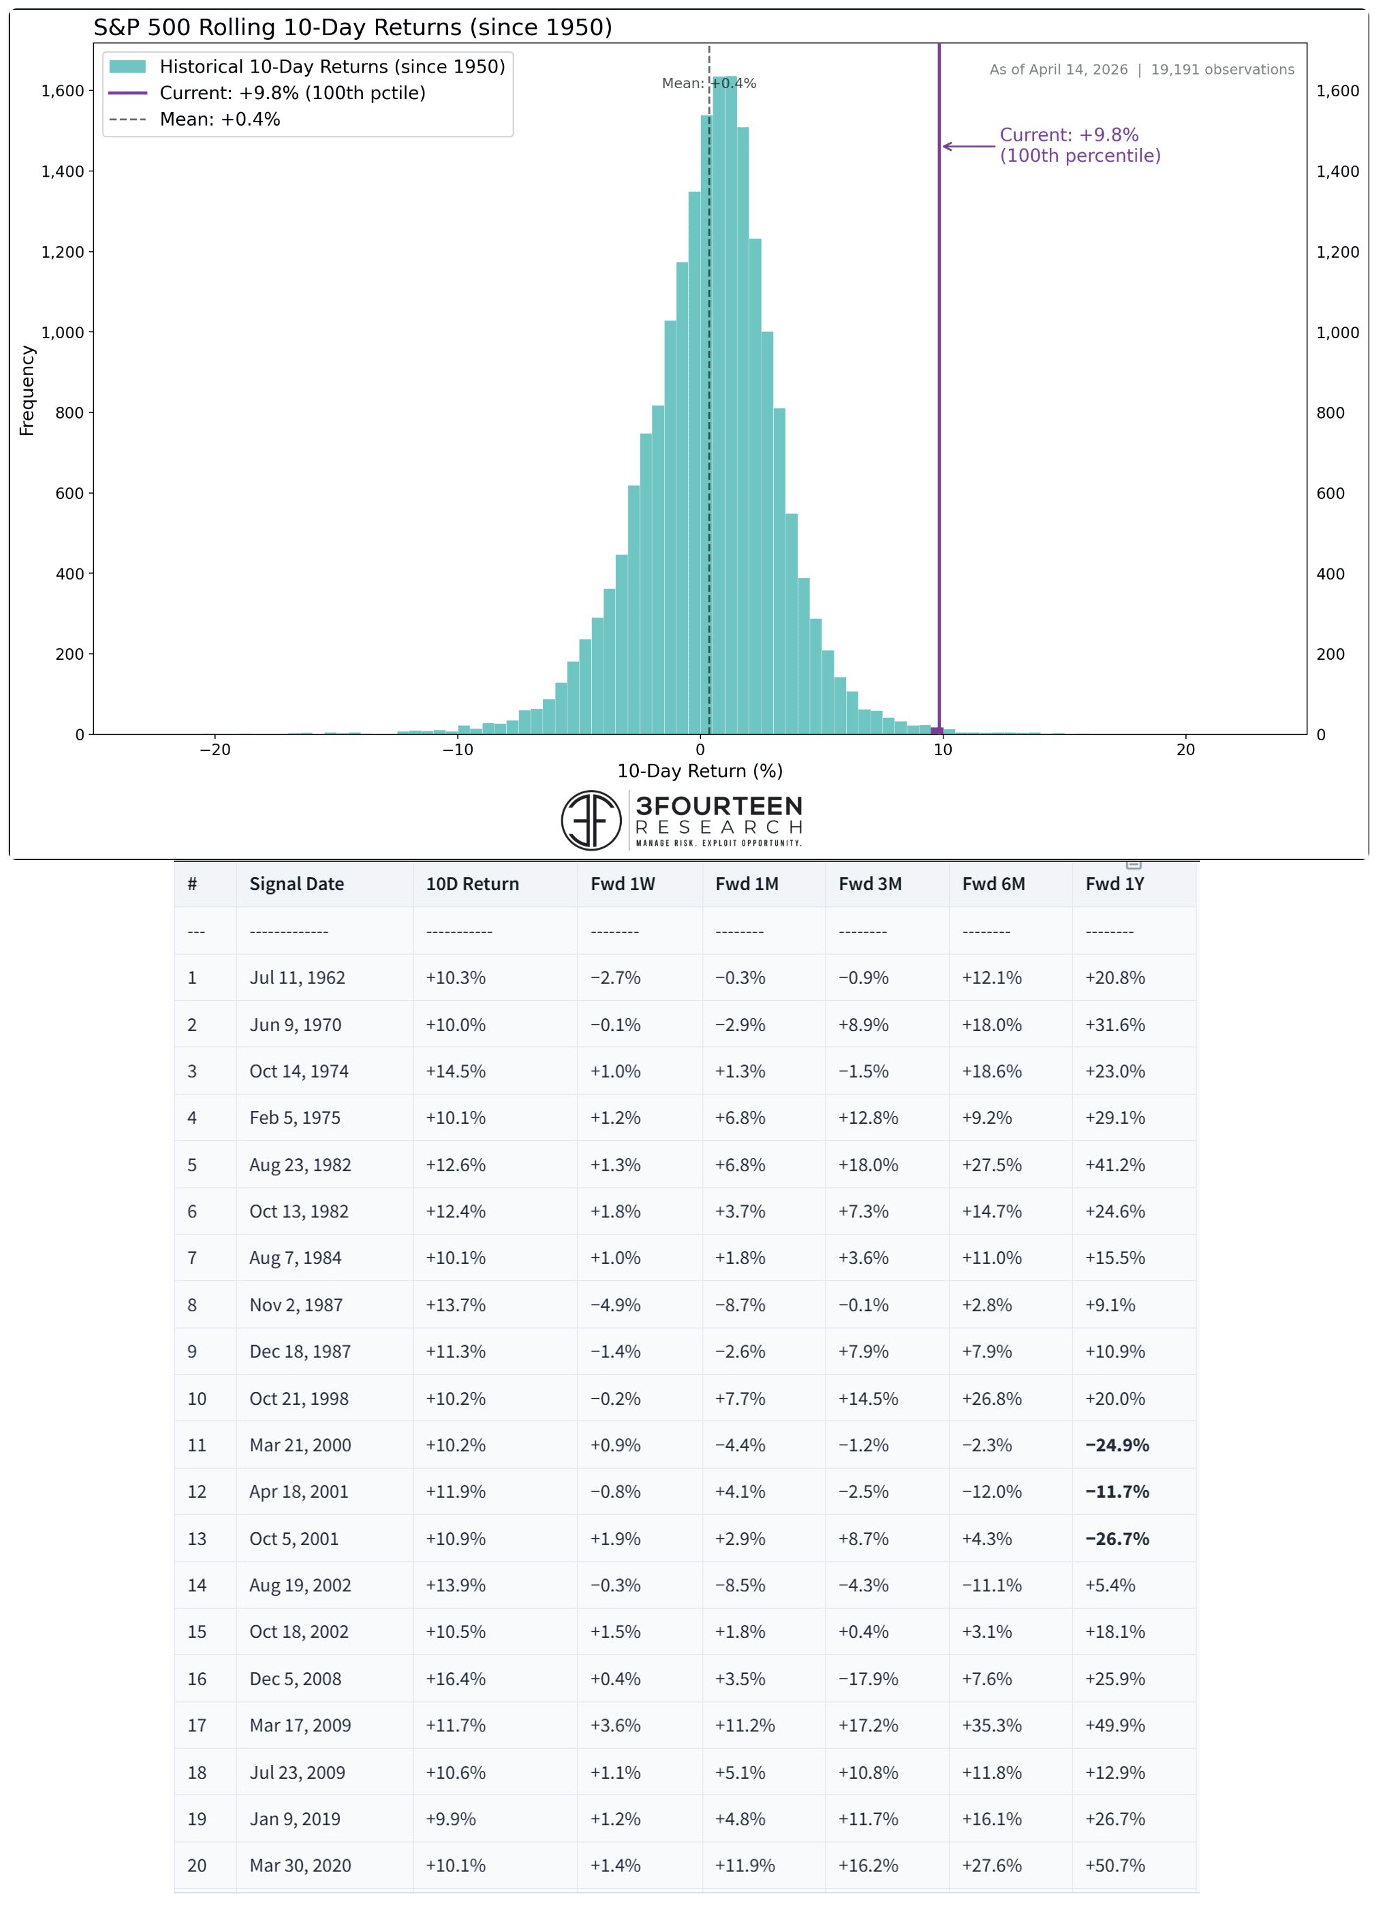
4. Momentum thrust. "The last 10-days have been unlike any 10-day period in the market since 1950 ... the S&P 500 is up 9.8% in 10-days, which is in the 99.7th percentile of all 10 day returns. Since 1950, there have been 20 cases where the stock market has risen this much in 10 days. General conclusion is that these are bullish 'momentum thrusts.'"
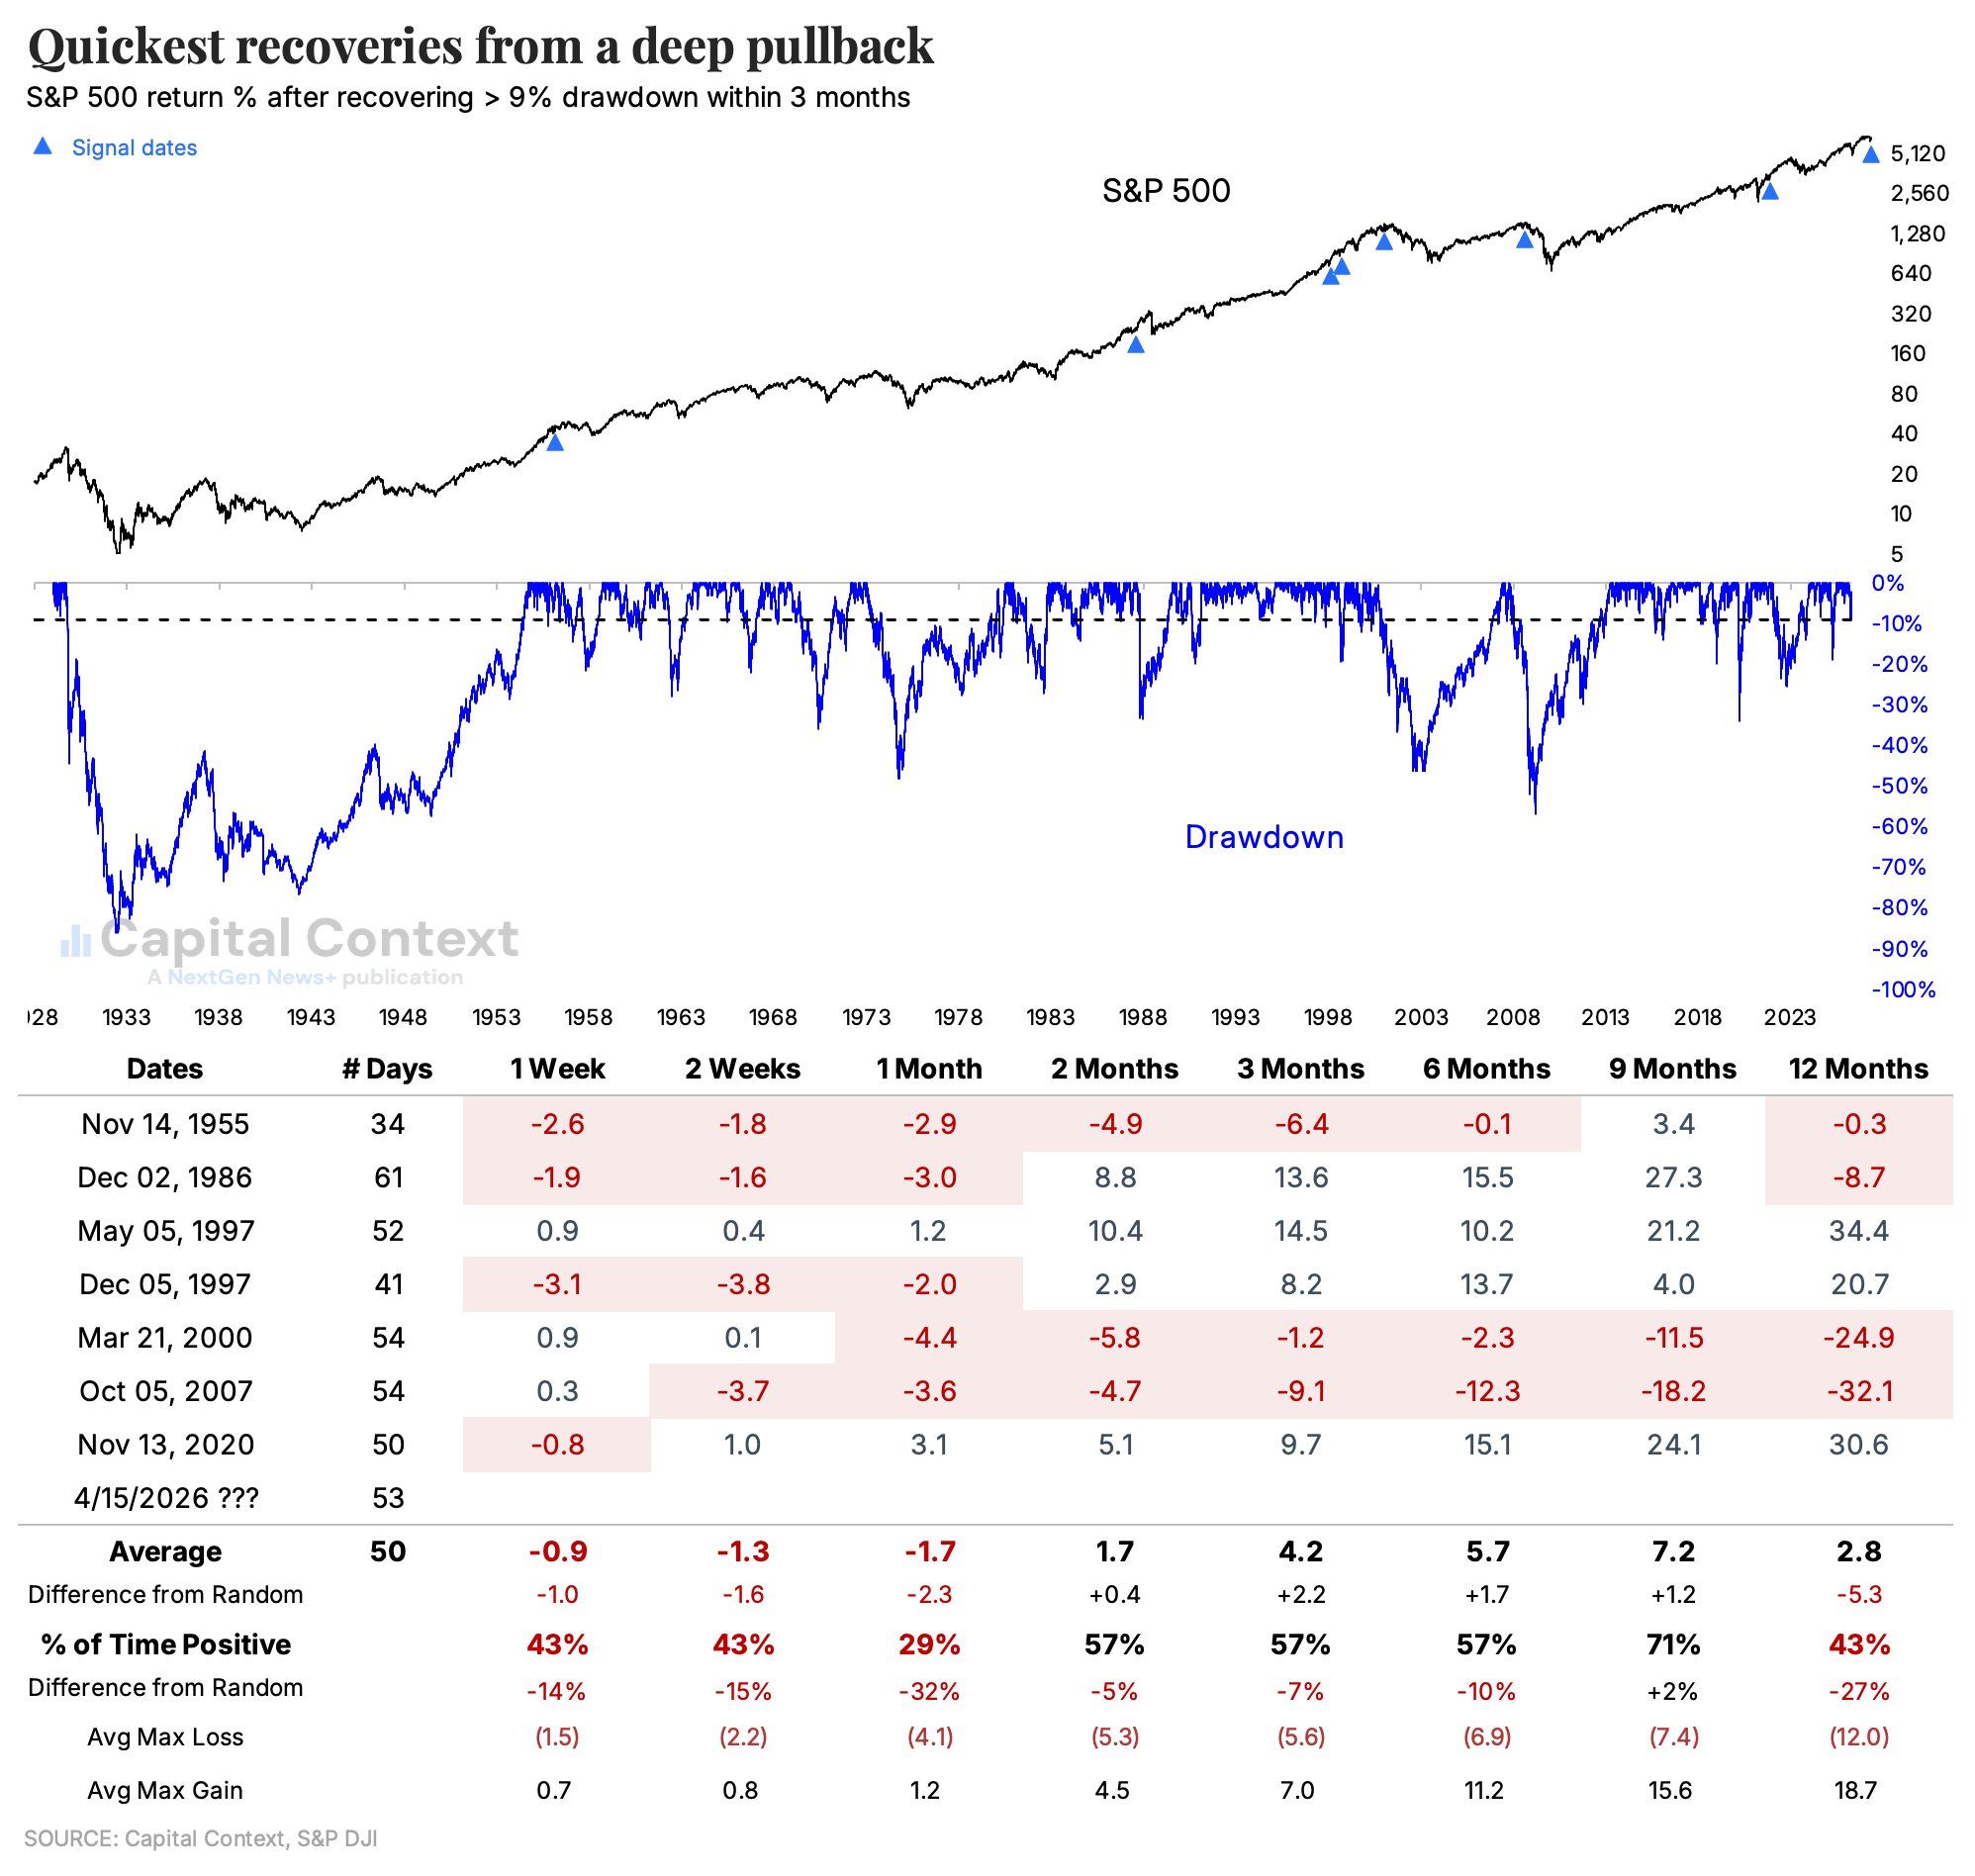
5. SPX recovery. The S&P 500 closed at a new high today, marking "the 5th-quickest recovery from a deep pullback. The others weren't necessarily all-clear signs."


Reply