- Daily Chartbook
- Posts
- DC Lite #401
DC Lite #401
"The chart that says a thousand words (with implication on trade war)"
Daily Chartbook
July 17, 2025
Welcome back to DC Lite: Daily Chartbook’s free, entry-level newsletter containing 5 of the day’s best charts & insights.
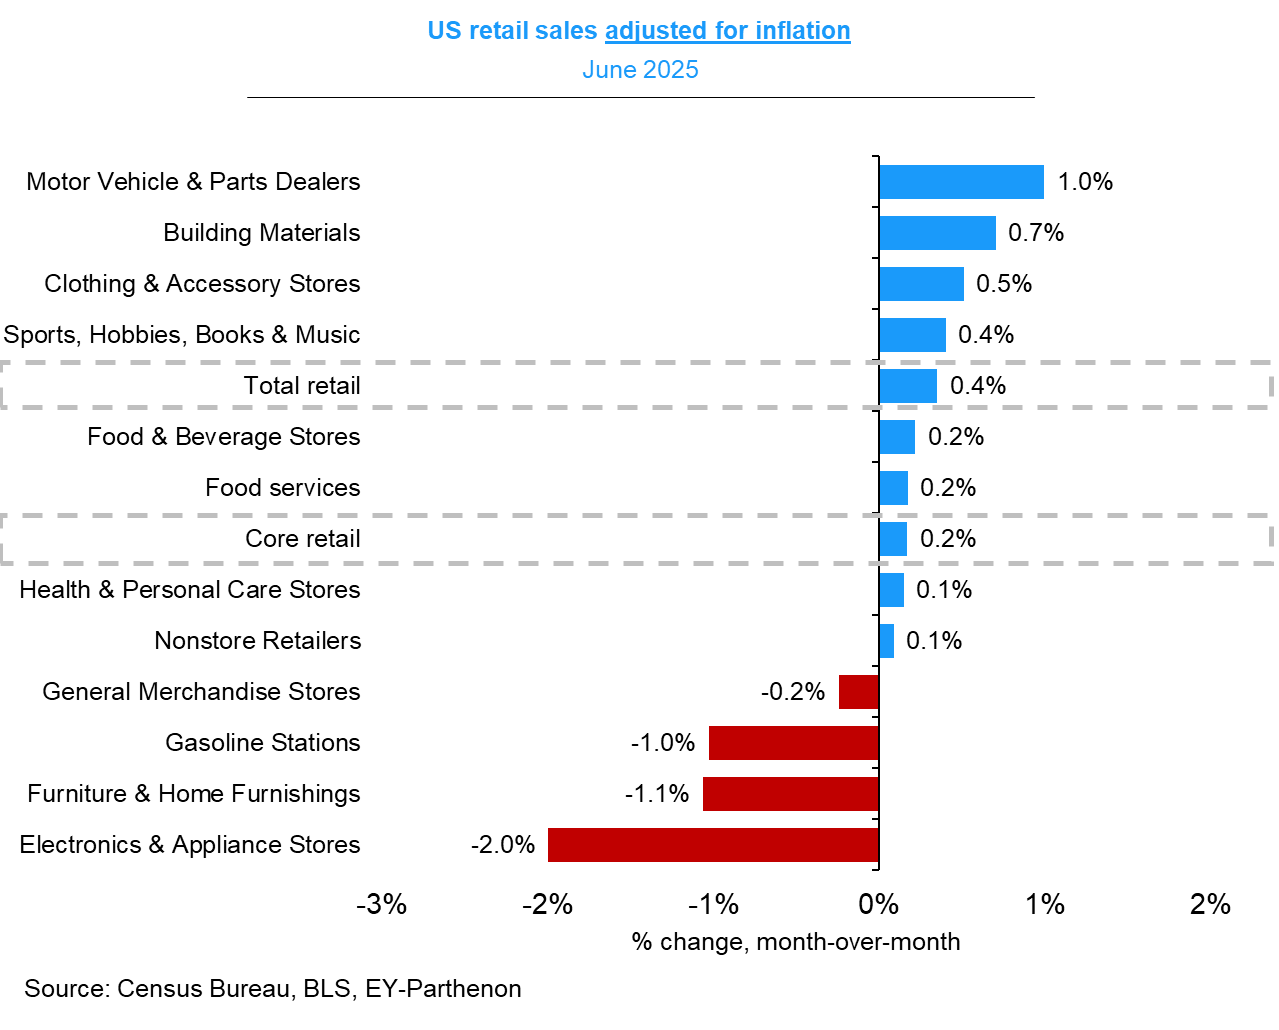
1. Retail sales. "Retail sales *volumes* show clear tariffs shock."
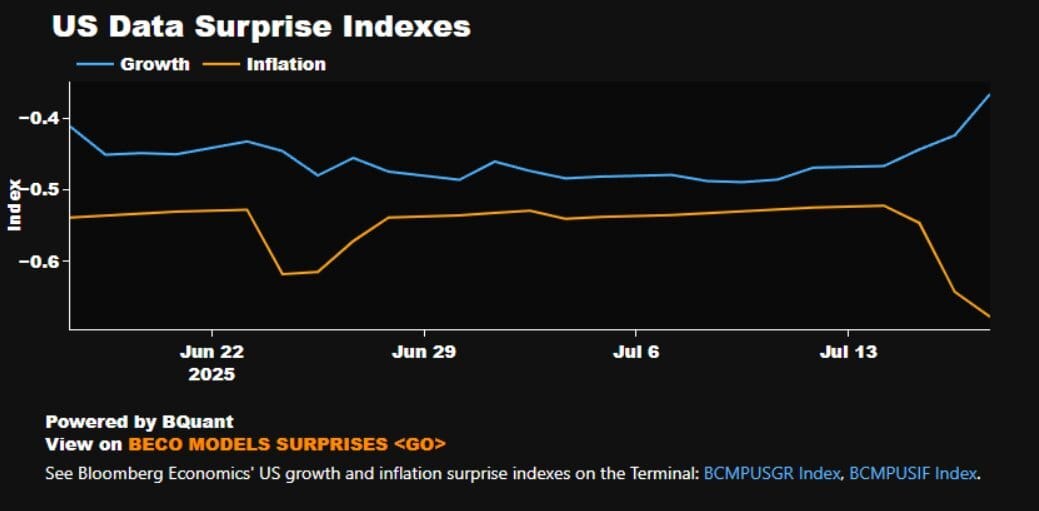
2. Data surprises. "The chart that says a thousand words (with implication on trade war)."
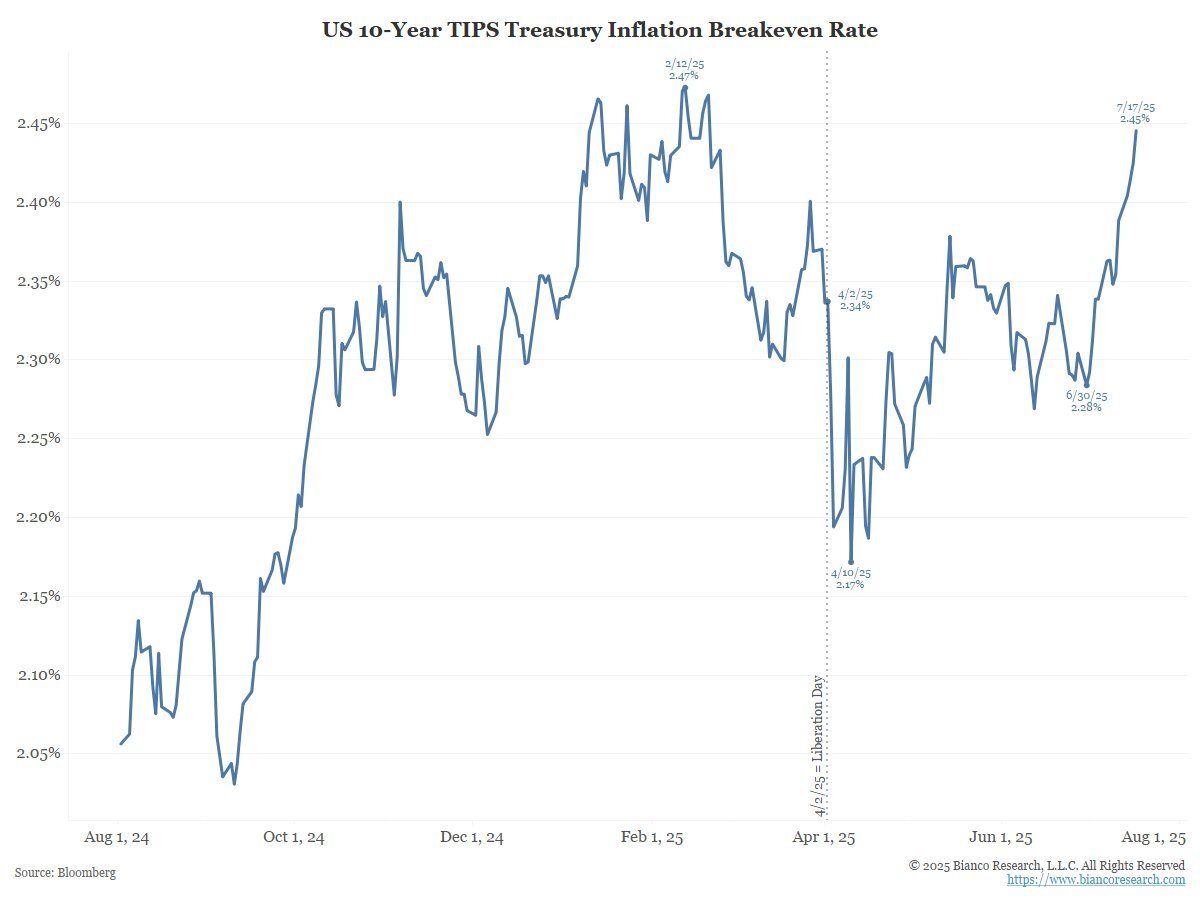
3. TIPS breakeven. "The 10-year TIPS Inflation Breakeven rate has continued its uptrend over the last year. Not what you want to see if your demand is a 300 bps Fed rate cut. Or is this the fear of what a 300 bps cut will do to the economy?"
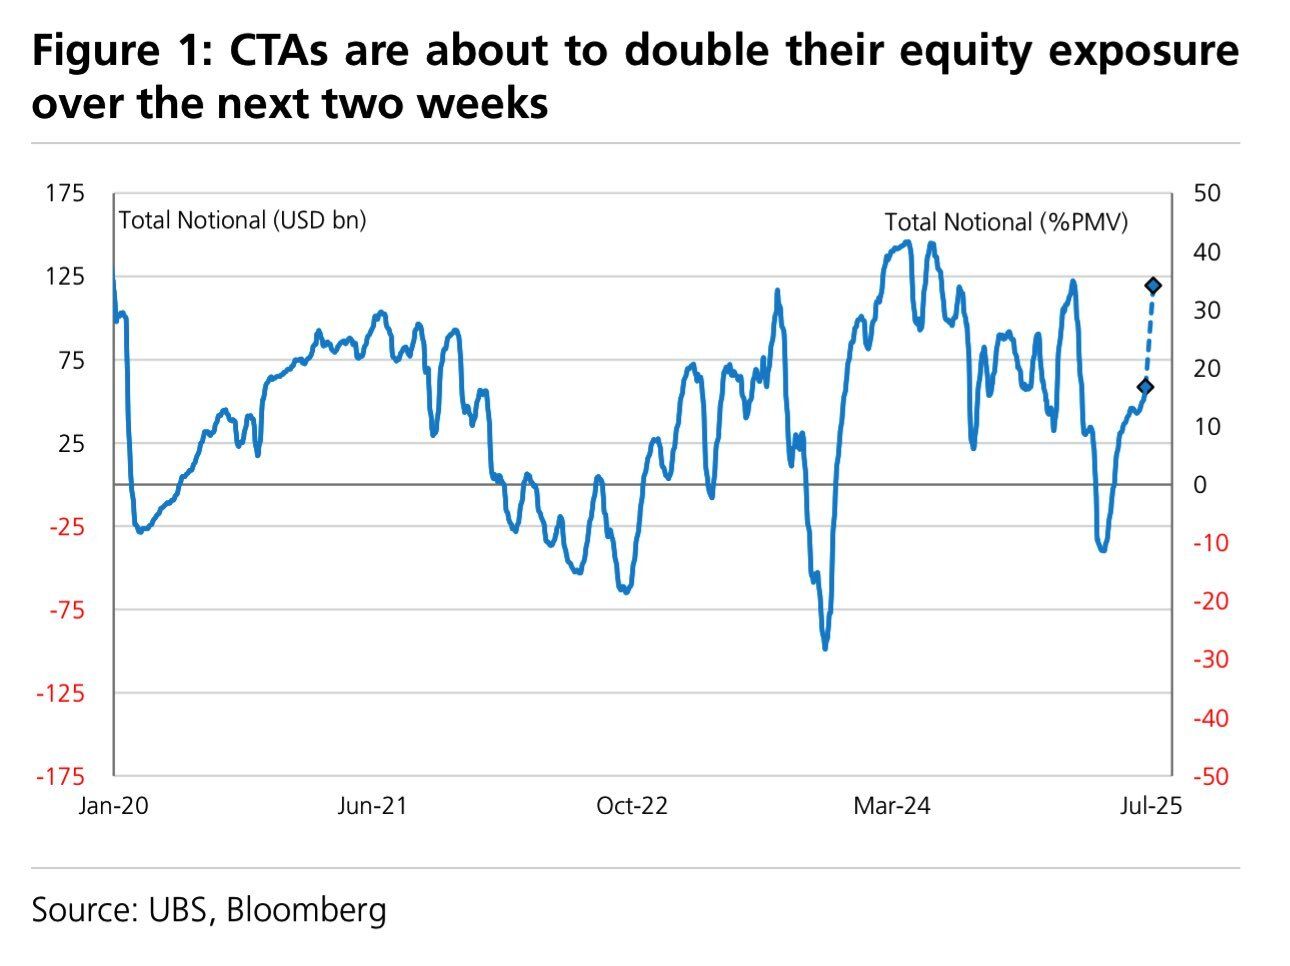
4. CTA equity exposure. "CTAs are about to double their equity exposure over the next two weeks."
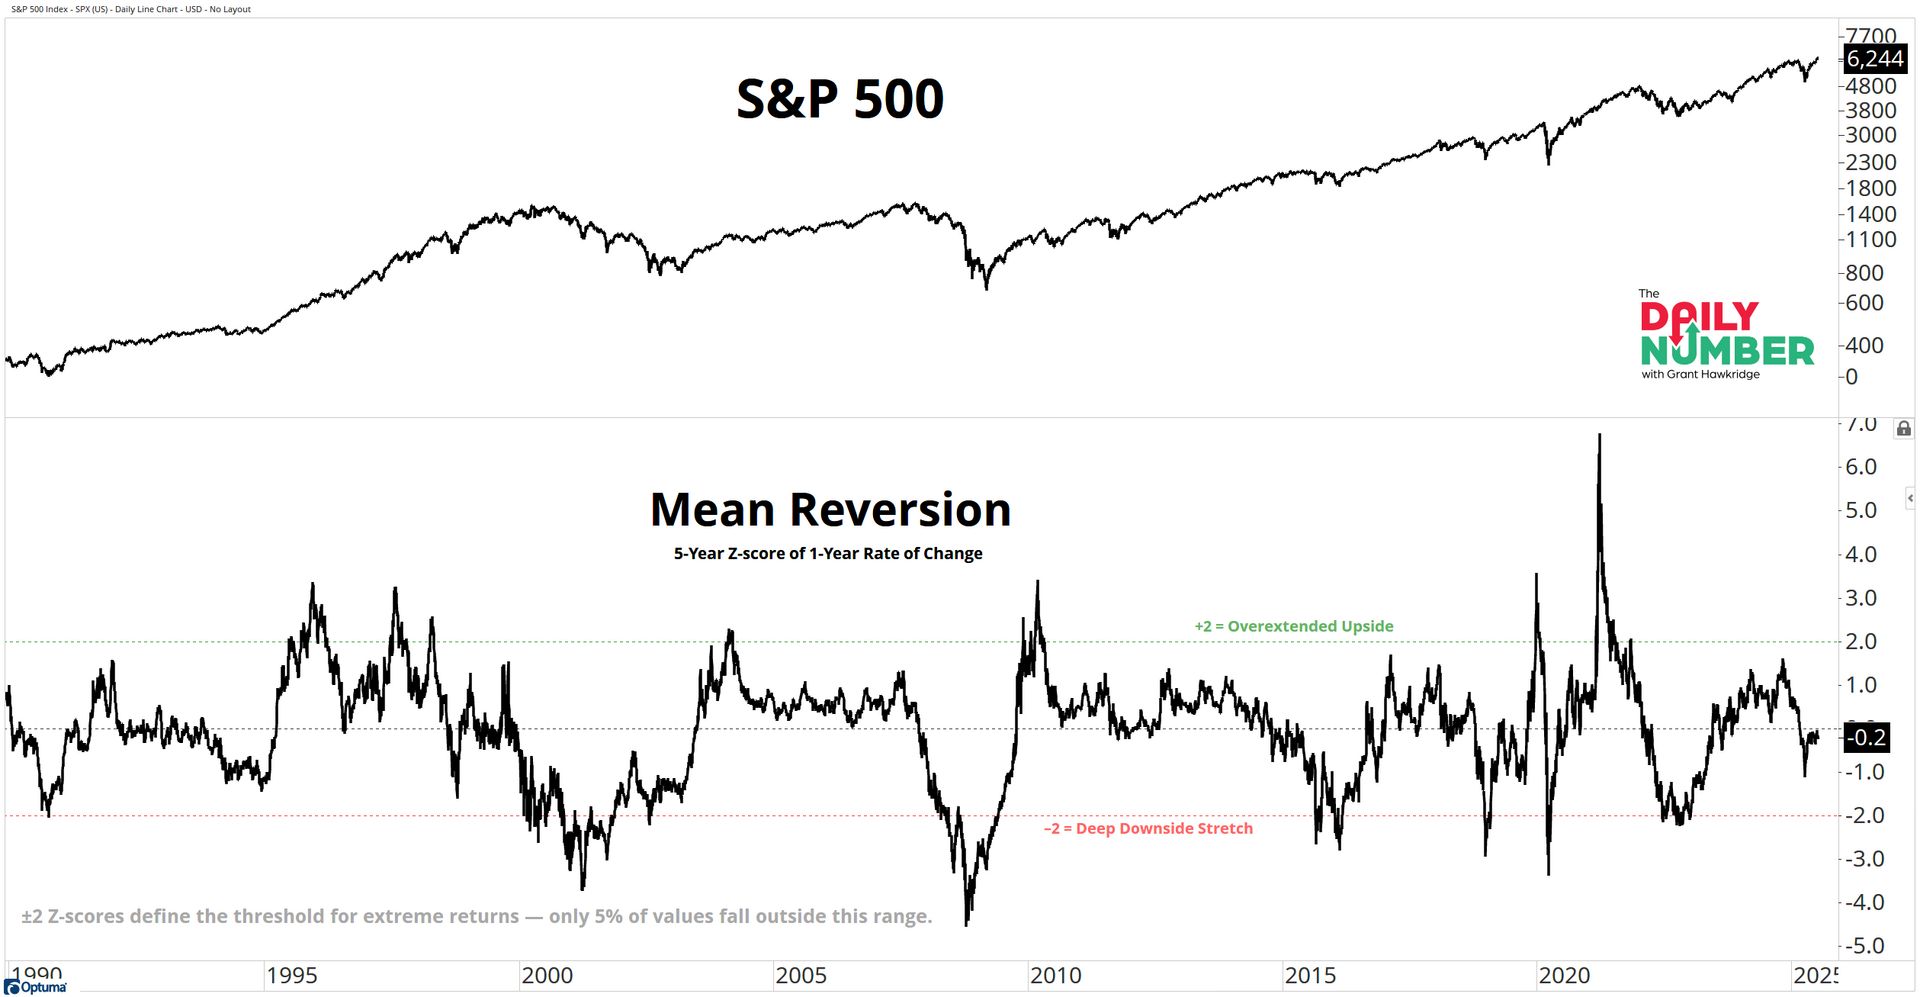
5. SPX YoY. "Despite the S&P 500 trading near all-time highs, the current 1-year return isn’t elevated relative to its recent history. The Z-score reading of –0.2 tells us that returns are sitting almost perfectly in line with the 5-year average."


Reply