- Daily Chartbook
- Posts
- "Historically, when vol reacts like this it has marked a tactical bottom in the S&P"
"Historically, when vol reacts like this it has marked a tactical bottom in the S&P"
DC Lite #553
Daily Chartbook
March 10, 2026
Welcome back to DC Lite: Daily Chartbook’s free, entry-level newsletter containing 5 of the day’s best charts & insights.
1. CPI forecasts. "Wall Street has inflation as measured by the CPI running sideways in February and holding near the lowest 12-month rates in five years* ... *at least until April, when the data collection/imputation distortions from the Oct govt shutdown could fully unwind".

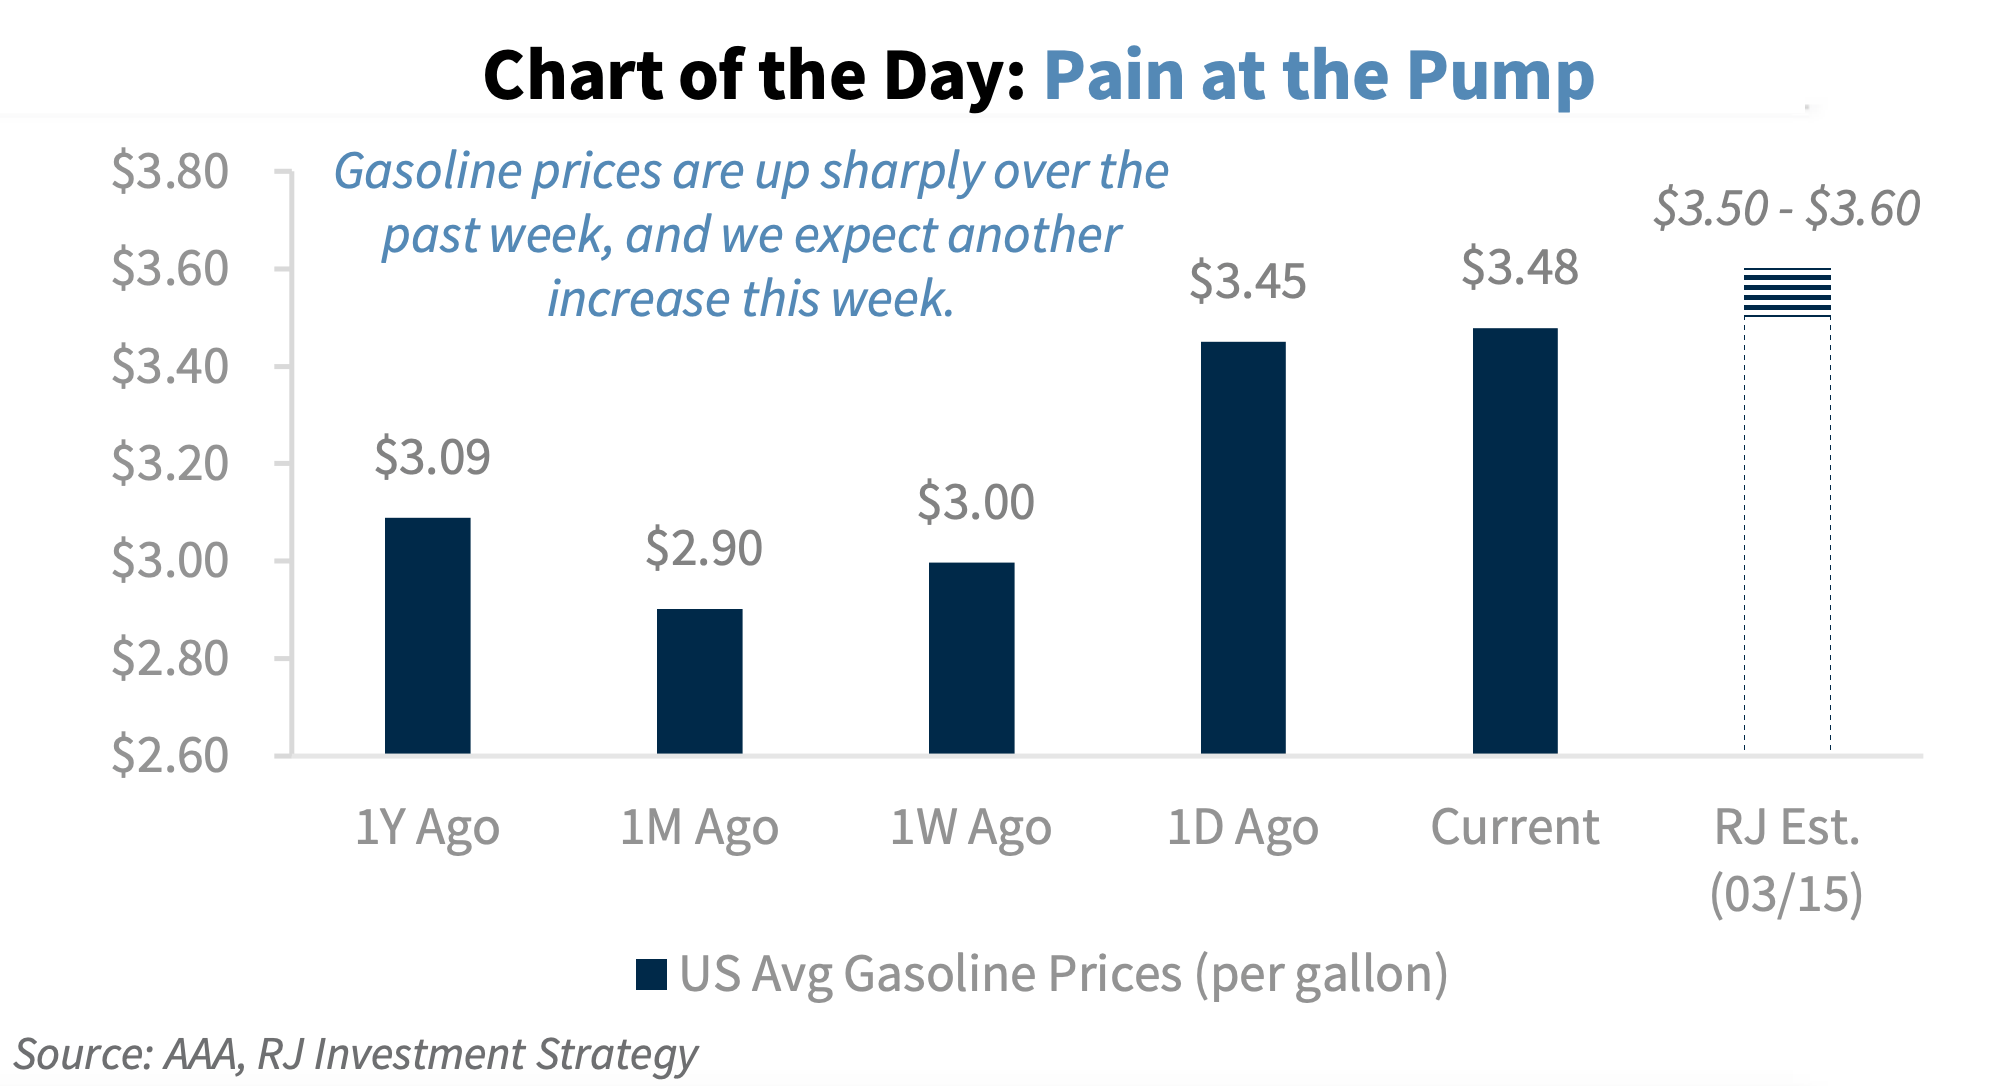
2. Gas prices. "Gasoline typically rises by $0.25/gallon for every $10/barrel increase in oil. Oil is up by $21 since the Iran conflict began, which suggests that gasoline's national average is set to rise by a total of $0.50-$0.60 once oil prices fully flow through the supply chain."
3. Investment Managers Index. "The IMI's Risk Appetite Index ... fell into risk averse territory in March ... the headline index has slumped from +13% in February to -16% in March, signaling net risk aversion for the first time since last September."

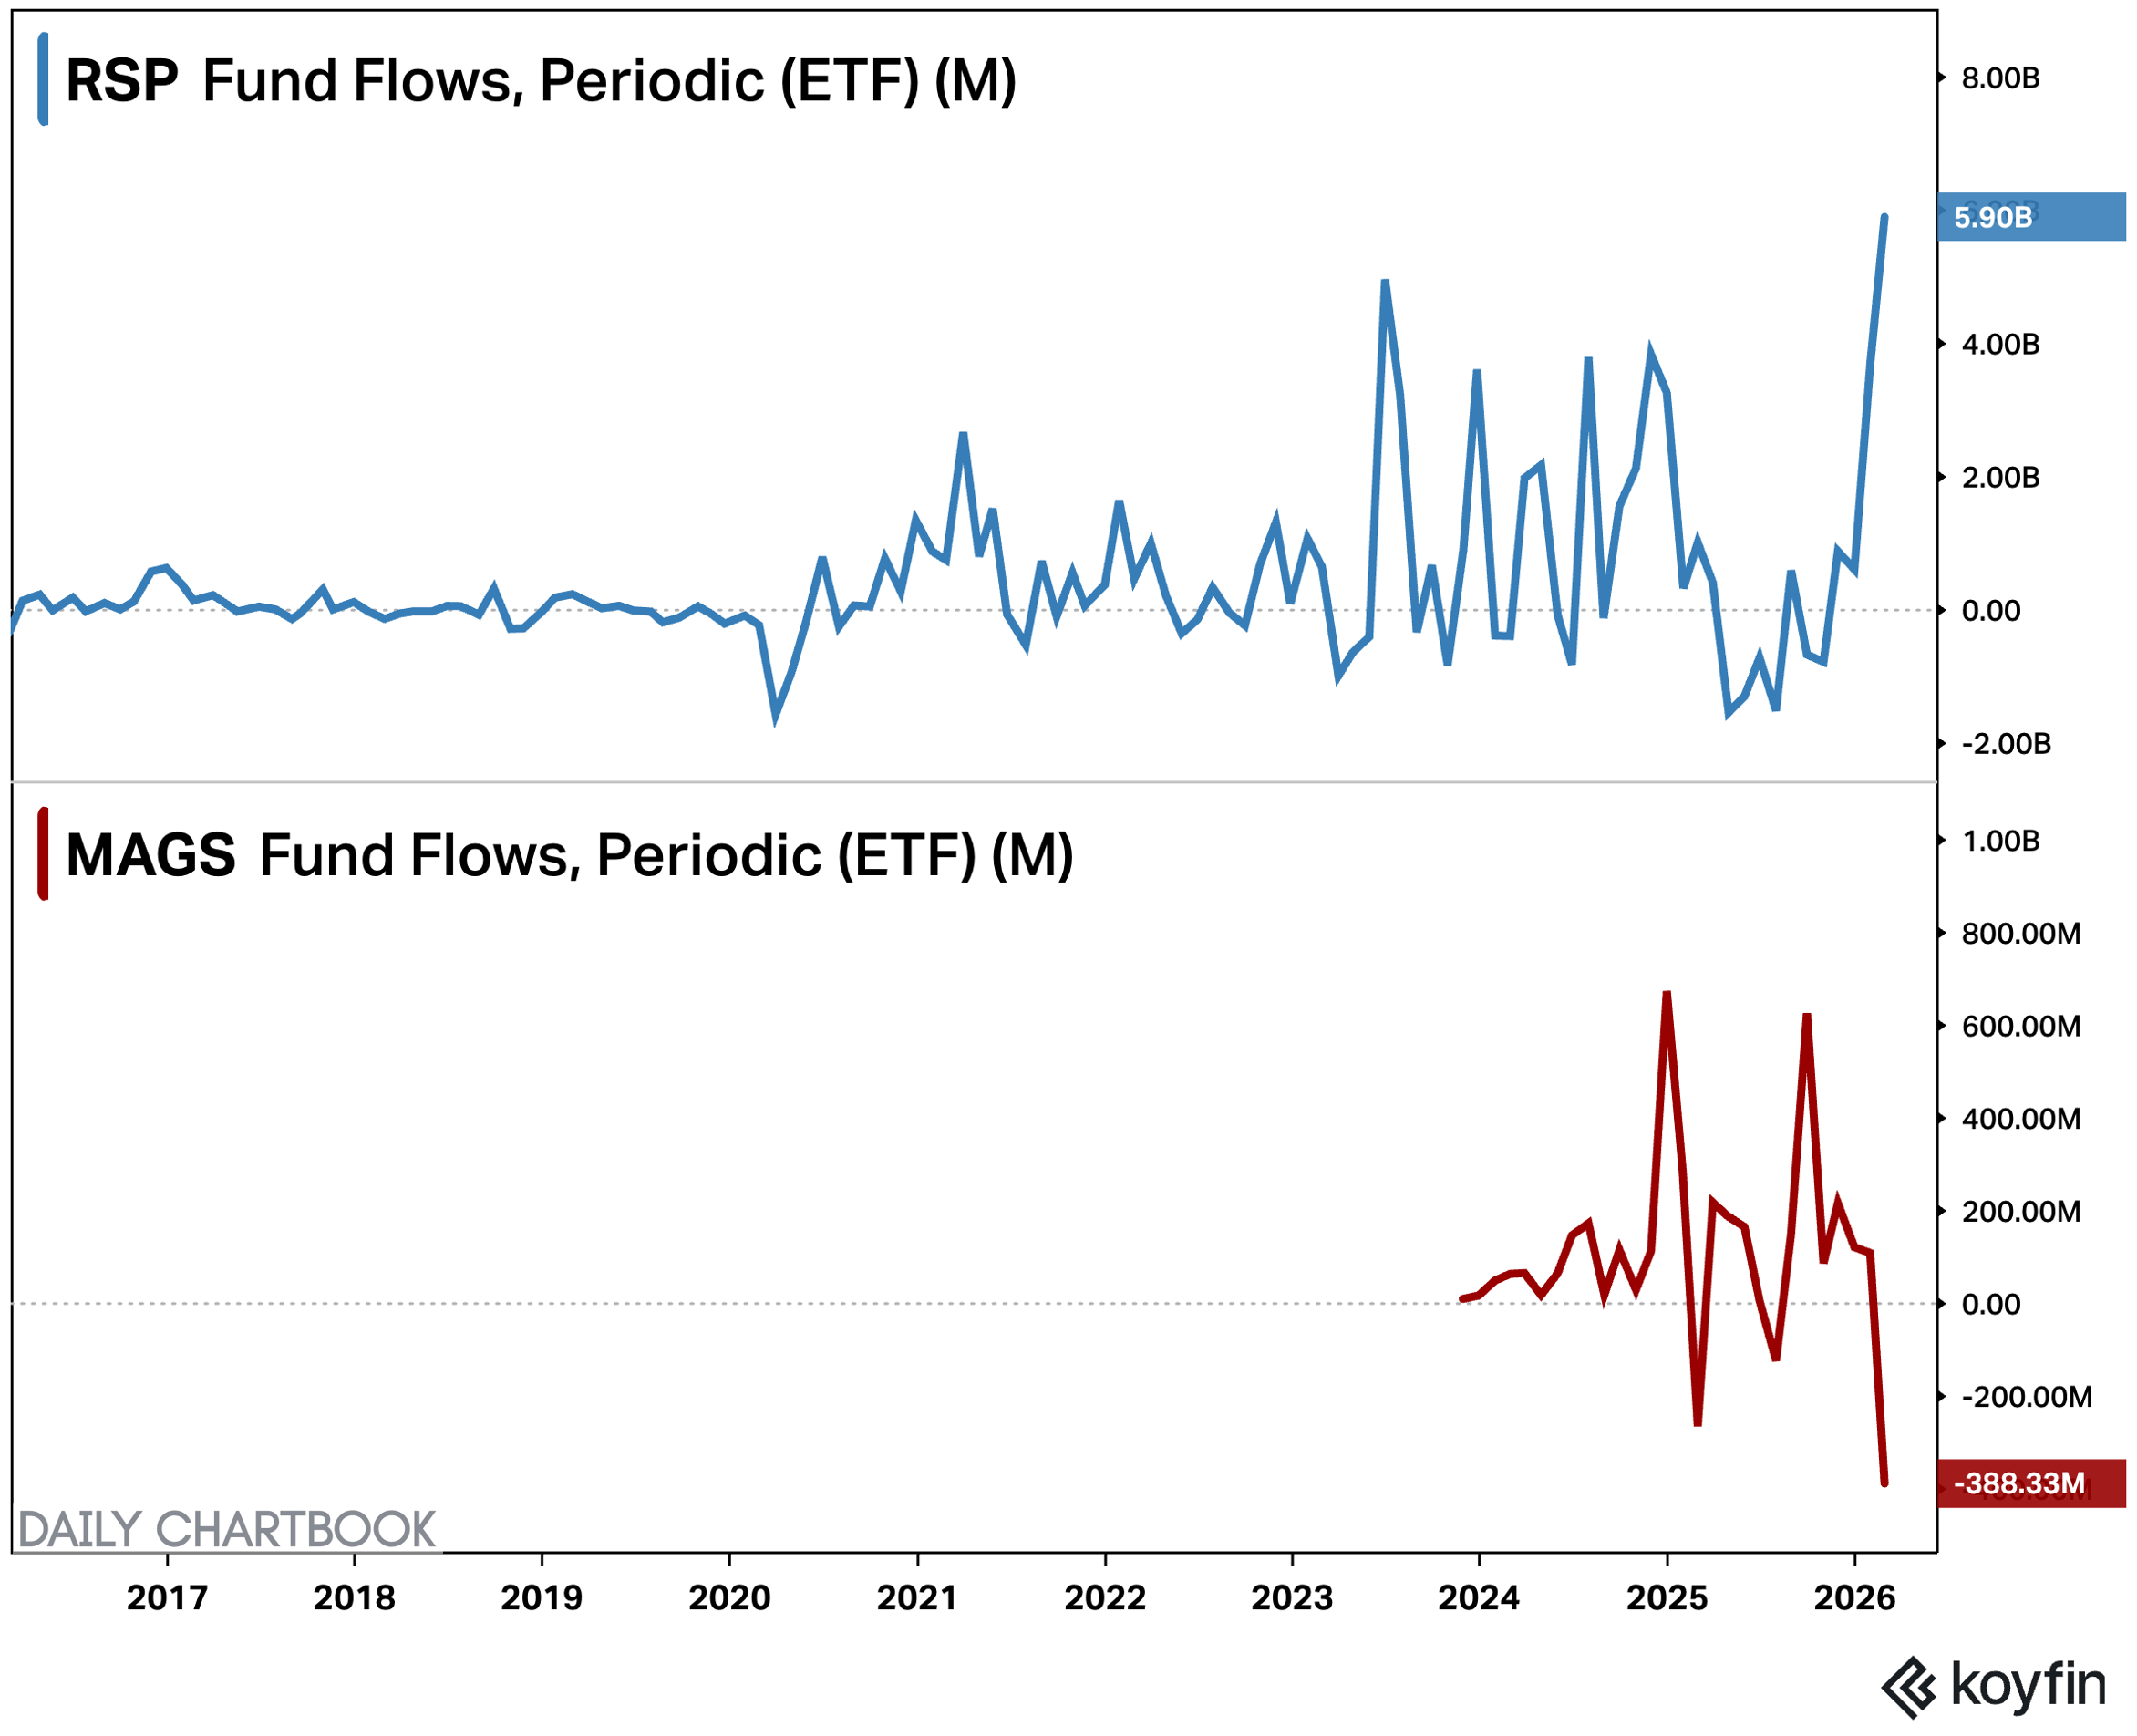
4. Weekly ETF flows. "Investors rotated aggressively out of U.S. large caps last week, favoring global funds, bonds, and broader equity universe (with a tilt towards consumer cyclicals)".

5. Volatility capitulation. "The vol market reaction to yesterday's trading suggests significant hedge unwinds went through. Investors sold protection in size, leading to one of the most significant underperformance of implied volatility (delta adjusted) in 2+ years ... Historically, when vol reacts like this it has marked a tactical bottom in the S&P".


Reply