Welcome back to DC Lite: Daily Chartbook’s free, entry-level newsletter containing 5 of the day’s best charts & insights. Upgrade to get all 30 charts.
1. Income vs. consumption. "For households in every quintile (or fifth) of the income distribution, the share of income required to pay for their 2019 consumption bundle decreased, on average, because income grew faster than prices did over that four-year period."
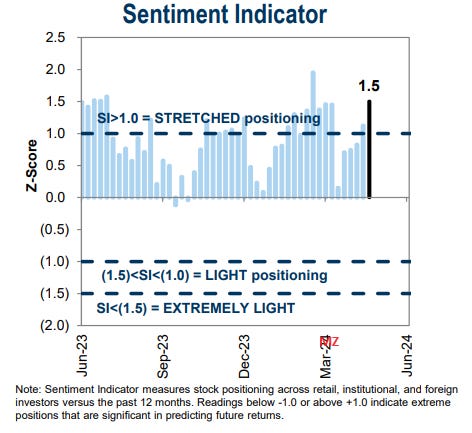
2. Sentiment Indicator. Goldman's equity positioning indicator moved further into "stretched" territory to a ~2-month high.
3. EM vs. DM ERP. "The difference in equity risk premia – a gauge of the excess yield investors receive for the risk of holding stocks over cash – between EM and DM equities has grown to its widest level in nearly four years, reflecting cheaper relative EM valuations."
4. SPX valuation (I). "At ~20.5x forward 12 month EPS, the S&P 500 is currently in the top decile of its historical range ... [while] the cyclically adjusted P/E is in the top 4% of all readings since 1881 and it's only been surpassed in 2021, 2000, and 1929."
5. Earnings reactions. “Stock reactions to earnings suggest that the bar is high this earnings season ... The bar was especially high for Tech, Communication Services and Energy, where beats underperformed the S&P 500 the next day.”


