- Daily Chartbook
- Posts
- Daily Chartbook #289
Daily Chartbook #289
Catch up on the day in 30 charts
Welcome back to Daily Chartbook: the day’s best charts & insights, curated.
1. Mortgage demand. Rising rates are keeping MBA mortgage activity down.

2. Total US housing market. "The total value of the U.S. housing market is 49% higher than before the pandemic."

3. Healthy consumer (I). "Looking at credit utilization on credit cards and home equity ==> both are running beneath pre-pandemic levels."

4. Healthy consumer (II). "Credit card debt at an all-time high, that is true. But as a % of disposable income just above 6%. Most might be surprised to hear this is lower than pre-pandemic and well beneath the 9% it was from 2000 to 2009."

5. National Financial Conditions Index. The NFCI "ticked down to –0.46 in the week ending September 22, suggesting financial conditions loosened again."

6. Bank lending. "Nominal bank lending growth slowed from 10% to 2% annualized since the start of the year."

7. Leveraged loans. "Nearly $270 billion of leveraged loans carry weak credit profiles and are potentially at risk of default."

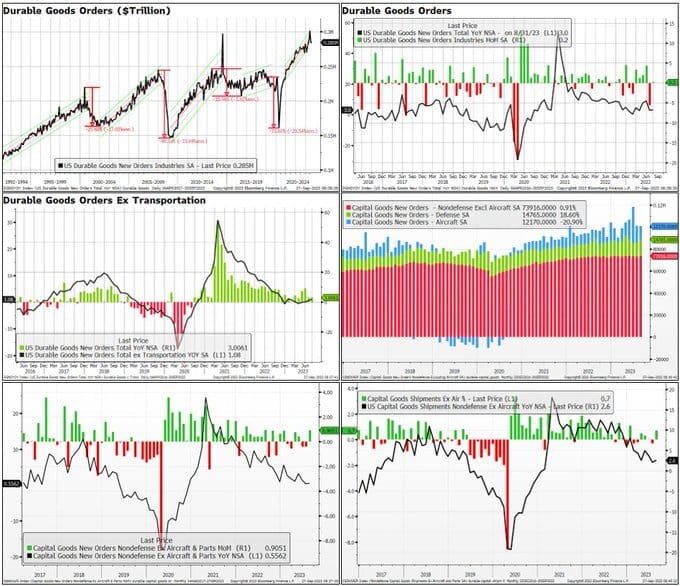
8. Durable Goods (I). "Orders came in stronger than expected rising 0.2% MoM (vs -0.5% est). Ex transportation was +0.4% (+0.2% est) while capital goods orders and shipments excluding air and defense rose +0.9% (vs +0.1% est) and +0.7% (vs flat est) respectively."

9. Durable Goods (II). "Core Capital Goods Orders have been downwardly revised 5 of the last 6 months."

10. Q3 GDP. The Atlanta Fed's GDPNow model estimate for Q3 GDP growth remained unchanged at 4.9%.

11. Oil scarcity premium. "This chart shows the implied crude oil scarcity premium, which was boosted by falling oil inventories at Cushing, OK (WTI futures settlement hub)."

12. OPEC+ cohesion. "OPEC+ cohesion has collapsed to near zero following the highest compliance rates in decades during the pandemic, a risk that could hurt the group next year."

13. OPEC+ spare capacity. "OPEC+ spare capacity is at a 25-year high (outside Covid)."

14. US commercial petroleum inventories. "Inventories fell 1.5 MMbbl last week, driven by a 2.2 MMbbl reduction in crude stocks. The is the first weekly total petroleum draw in roughly a month."

See:
15. Dollar driver. "The big driver behind the dollar’s moves (yellow line) over the past year has been the yield differential between US bonds and global bonds (blue line)."

16. TIPS vs. fixed income yield. "With the exception of one day when the market was scarcely functioning during the onset of the pandemic in March 2020, this is the narrowest gap since 2009."

17. MMF vs. rates. "Year/year % change in money market fund assets (orange) approaching +23%, which is typically consistent with recessions when looking back in history … key difference is that rates were falling in those episodes."

18. Post hike cycle. "Bond yields typically peaked around the last Fed hike and moved lower in the aftermath. In contrast, equities do not show a clear pattern, but tend to hold up or grind higher after the Fed stopped hiking rates, after initial wobbles."

19. SPX vs. net liquidity. "It's not so much the peak or pause in rate hikes that matters, but rather what happens to the Fed balance sheet & reverse repo operations."

20. Risk-Love. The Global Equity Risk-Love indicator is in the neutral zone and at 40th percentile vs. history. That's down from the 51st percentile last month and the 81st in July.

21. Investor Intelligence sentiment. "II bulls: 43.7% & II bears: 23.9%. Bull-bear spread is at lowest level since March. All the net gains in the S&P 500 since 2015 have come when this has been above 20%."

See:
22. Exposure plans. Among JPMorgan clients, "equity exposure/sentiment is ~45th percentile, on average; 27% plan to increase equity exposure and 77% to increase bond duration."

23. Equity buyers. "US households have continued to increase their equity allocation this year, having been the biggest buyers of US equities during this cycle."

24. Rebalancing. "Heading into quarter-end, the desk's model estimates a net of $3 billion of US equities to sell from US pensions given the moves in equities & bonds over the month and quarter."

25. Put/call ratio. "30 dma of equity put/call ratio for the last 20 yrs. With few exceptions has it strayed outside the range."

26. Bull market breadth. "For bull markets that started in 2002, 2009, and 2020, % of NASDAQ 100 members trading above 200d moving average breached 90% threshold within a year of start; index hasn’t yet gotten there even though it’s almost a year off October 2022 low."

27. US vs. international equities. "International stocks are trading at a deep discount relative to US equities."

28. R2K vs. SPX. "The Russell only outperforms the S&P 500 when high yield corporate bond spreads over Treasuries are declining from higher levels than we have today."

29. Typical correction. "The August-September correction is not atypical by historical standards."

30. VIX vs. SPX sell-offs. And finally, the VIX reaction to the recent sell-off in stocks has been relatively muted.

Thanks for reading!
Reply