Welcome back to Daily Chartbook: the day’s best charts & insights, curated.
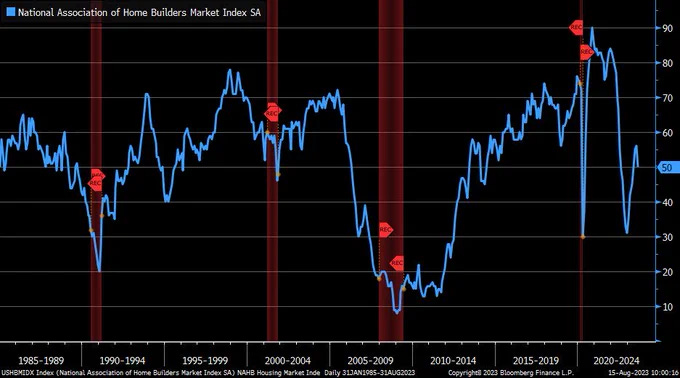
1. Homebuilder sentiment. "Housing Market Index from [NAHB] pulled back in August to 50 vs. 56 est. & 56 in prior month … all components deteriorated with prospective buyers traffic falling most … future expectations for sales contracted for second consecutive month."
2. Credit event. US and EU commercial real estate is the top credit concern among FMS investors.
3. Tail risks. High inflation and hawkish central banks remain the biggest tail risk for FMS investors.
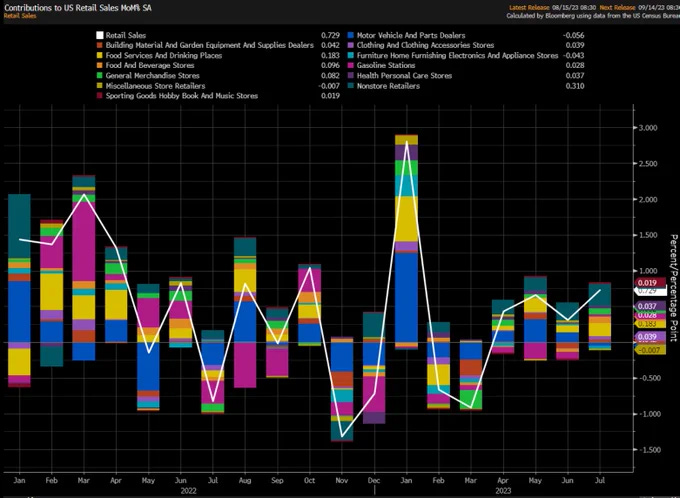
4. Retail sales (I). Retail sales increased 0.7% MoM (vs. +0.4% est) in July for the 4th consecutive rise.
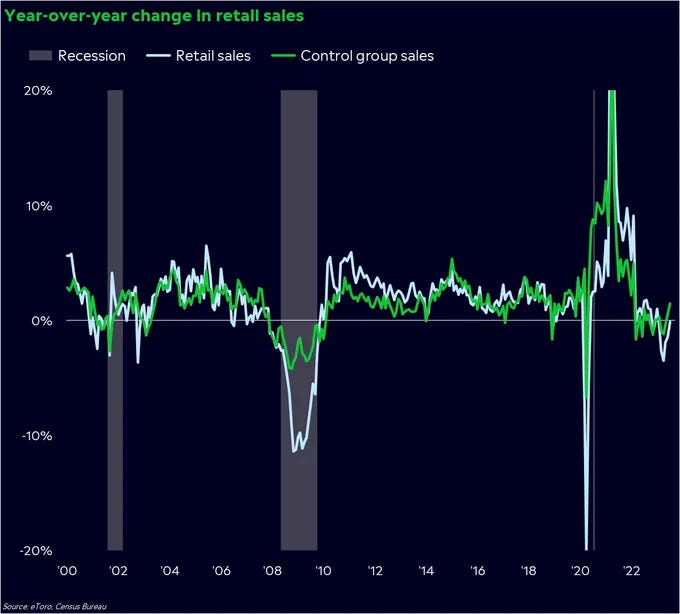
5. Retail sales (II). On an annual basis, sales grew 3.2% in July, the biggest annual gain since February. “Strip out food and gas, and retail sales accelerated at the fastest YOY pace since Feb. 2022.”
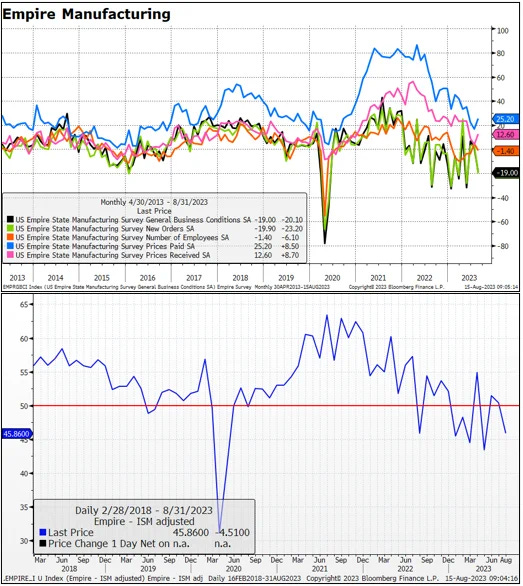
6. Empire State Manufacturing. “Empire Manufacturing continues the weak manufacturing narrative as it drops 20pts to -19…new orders slumped 23.2pts, number of employees dropped 6.1. But prices paid and received both rose.”
7. Q3 GDP. The Atlanta Fed's GDPNow estimate for Q3 GDP growth jumped to 5.0% from 4.1% on August 8 driven by consumer spending.
8. Global economic outcomes. “‘Soft landing’ remains the consensus (65% in August from 68% in July) while ‘no landing’ probabilities have risen (9% from 4% in July).”
9. Recession fears. "Recession concerns fading...42% of FMS investors say the global economy is unlikely to experience recession over the next 12 months, most since Jun'22."
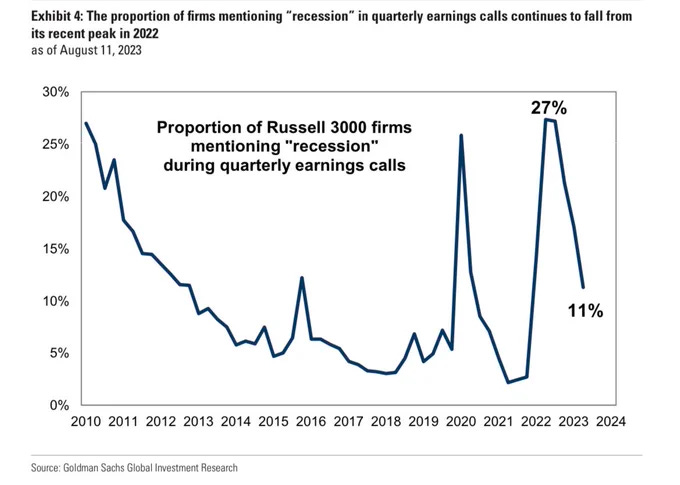
10. Recession talk. "No one mentions ‘recession’ anymore."
11. USD bearishness. "Consensus is overwhelmingly bearish USD. This is also reflected in positioning, where real money and leveraged funds are net short dollars. The level of bearishness appears over done."
12. FMS vs. commodities. "Global fund managers covered their bets against commodities."
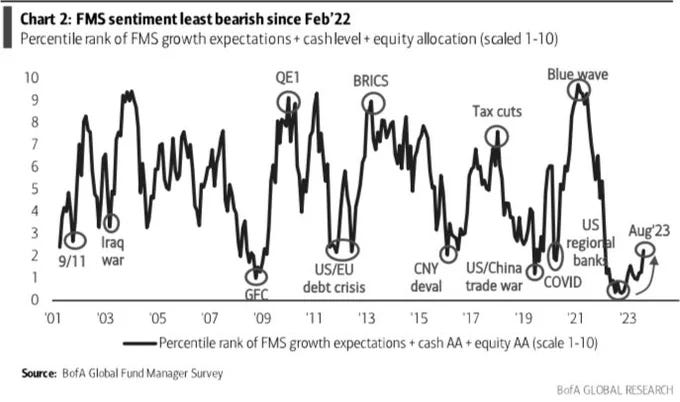
13. FMS sentiment. “Least bearish FMS since Feb'22.”
14. Sentiment indicators. Risk sentiment across indicators.
15. Exposure plans. Among JPMorgan clients, "31% plan to increase equity exposure, 68% to increase bond duration."
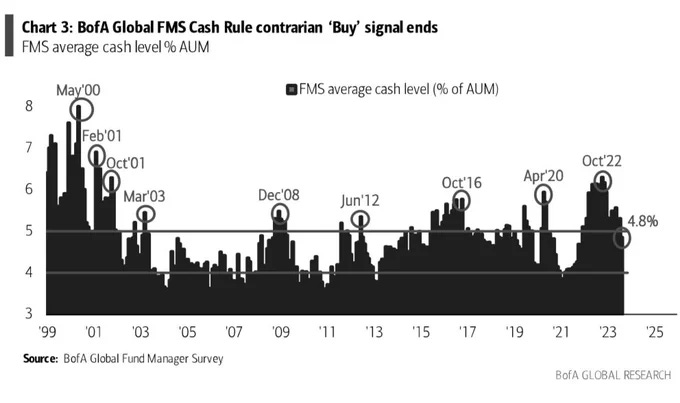
16. FMS cash levels. "Cash drops from 5.3% to 4.8% (21 -month low)…FMS cash <5% means end of BofA Global FMS Cash Rule contrarian ‘buy signal’."
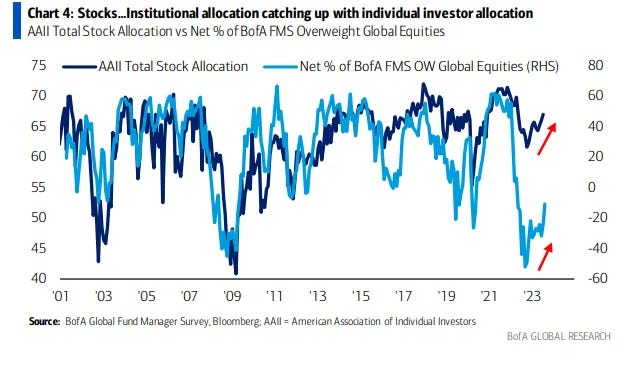
17. Cash vs. equities. "FMS investors now least OW cash since Sep'21 and shifted back into equities (allocation up 13ppt MoM to the least UW equities since Apr'23). On a relative basis, investors are least underweight equities relative to cash since Feb'22."
18. FMS vs. equities. "Allocation to equities least UW since Apr’22, up 13ppt MoM to net 11% UW, biggest monthly increase since Nov’22."
19. FMS rotation. "In August, FMS investors rotated into stocks, EM/Japan, tech, energy, and out of REITs, cash, industrials, US/EU."
20. FMS positioning. "This chart shows absolute FMS investor positioning (net %)...Bullish: EM, healthcare, alternatives, cash; Bearish: real estate, utilities, US & UK, discretionary."
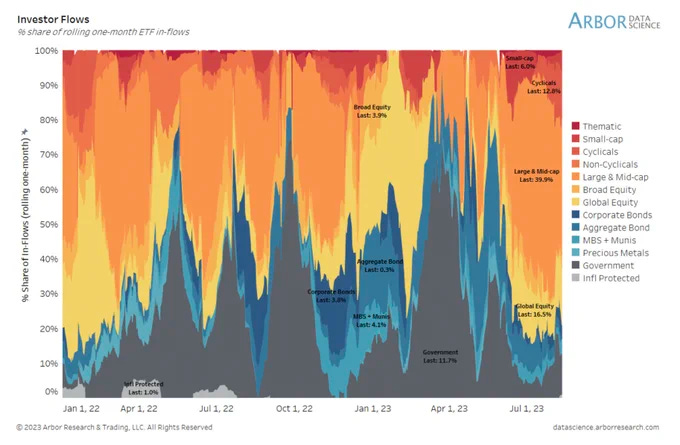
21. Investor flows. "Investors poured into large-cap and broad equity ETFs last week yet, within that space, moved away from large-cap tech; for fixed income, agg and muni areas were of most interest."
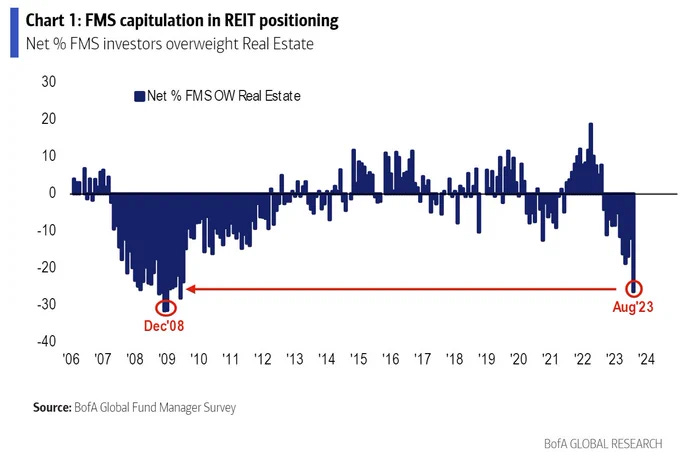
22. FMS vs. REITs. Capitulation in REIT positioning is at GFC levels.
See: ,
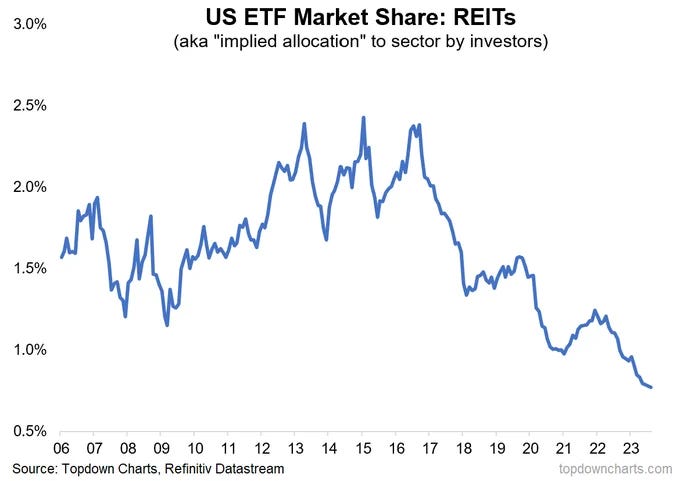
23. Retail vs. REITs. "Interestingly enough, Retail hate REITs too."
24. FMS vs. tech. "Allocation to tech continued to rise to net 19% OW, up 11ppt MoM to the highest OW since Dec'21."
25. Most crowded trade. "Long Big Tech remains the most crowded trade for the 5th month in a row."
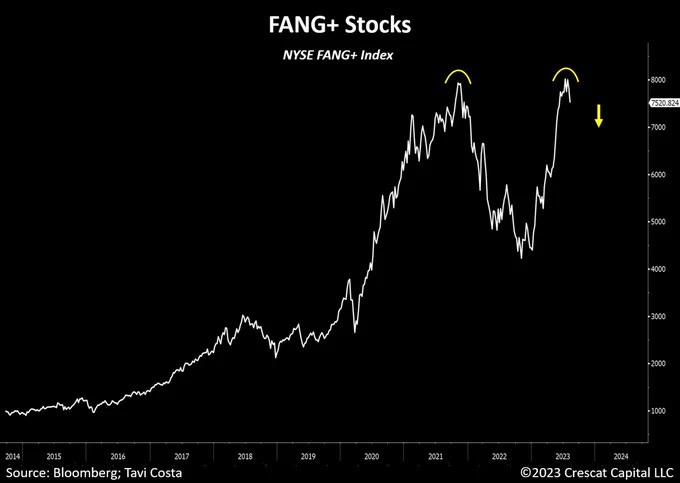
26. FANG+ double top? "The FANG+ index almost perfectly re-tested its prior highs from late 2021, and recently formed what appears to be a double top."
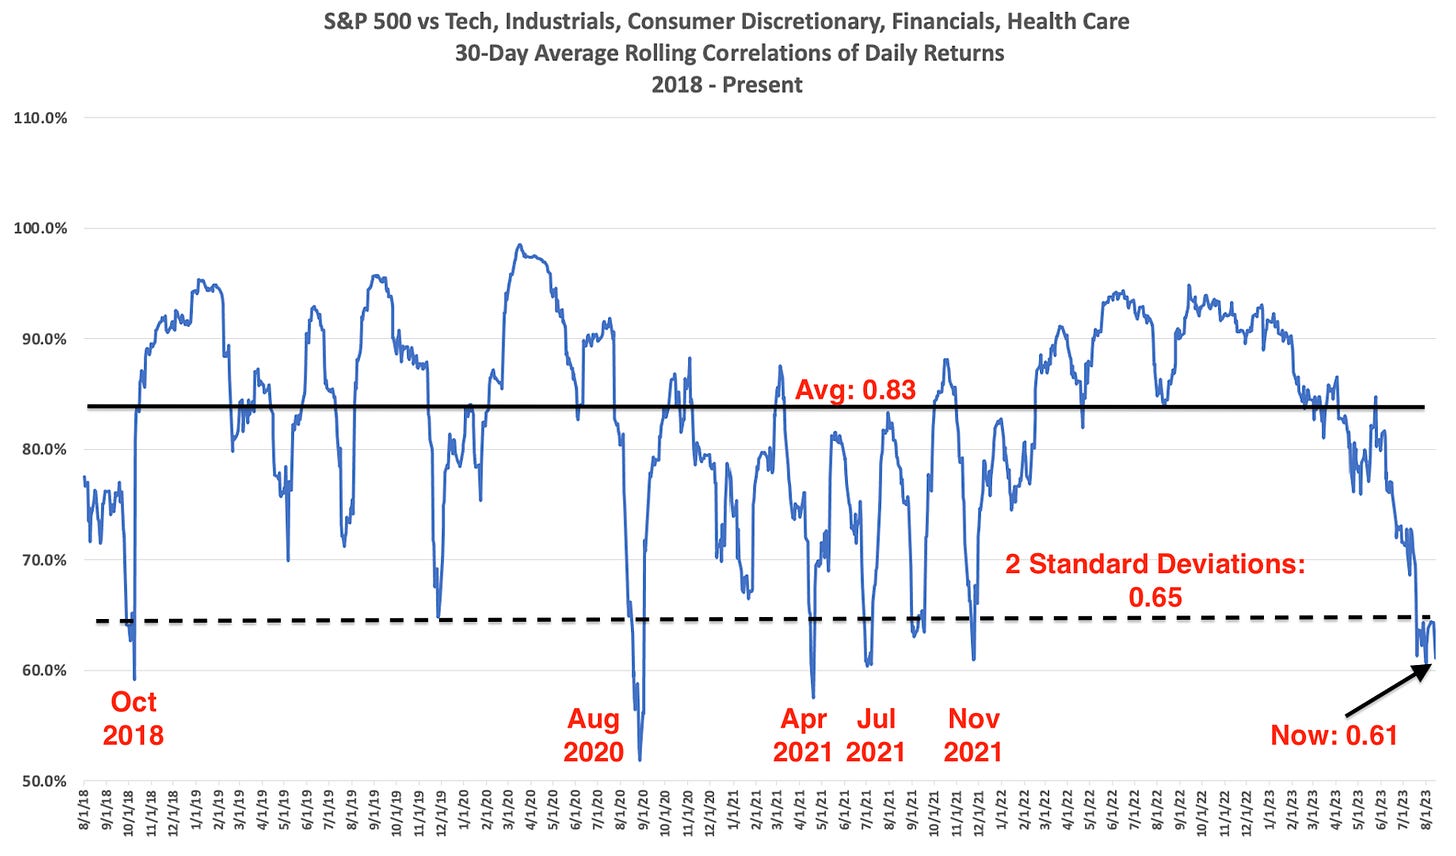
27. Sectors vs. SPX. “The current average S&P sector reading is extremely low…correlations are 0.61, below the 2 standard deviation level.”
28. Equal- vs. market-weight. "The equal-weighted S&P 500 has been improving relative to the cap-weighted S&P 500, especially among cyclical value stocks."
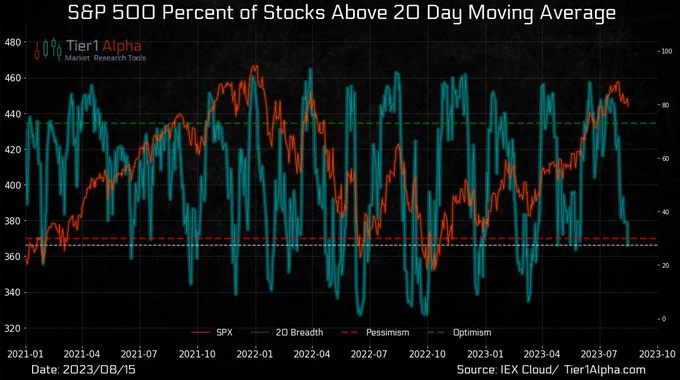
29. SPX breadth. "Short-term breadth is taking a beating. Only 27% of $SPX is still trading above their respective 20-day moving averages, down from 80% just a month ago."
30. No-recession bear. And finally, “the US market is behaving consistently with past performance during no-recession, 'minor' bear markets and the subsequent recovery.”
Thanks for reading!


