- Daily Chartbook
- Posts
- Daily Chartbook #249
Daily Chartbook #249
Catch up on the day in 30 charts
Welcome back to Daily Chartbook: the day’s best charts & insights, curated.
1. Logistics. The Logistics Managers’ Index fell to 45.4 in July for its 3rd consecutive month of contraction. It was the 5th straight new all-time low.

2. Global growth outlook. "12m rolling global growth expectations show more upgrades than downgrades."

3. Financial conditions. "The nominal GS US Financial Conditions Index eased by 1.6bp to 99.4 over the last week, as higher equity prices and lower BBB credit spreads more than offset a higher 10-year Treasury yield."

4. Lag effect. "Fed rate hikes have yet to kick in. The Fed-sensitive (cyclical) CPI component is still near the highs."

5. Redbook. US Redbook YoY retail sales edged back up to positive territory last week, rising by 0.1%.

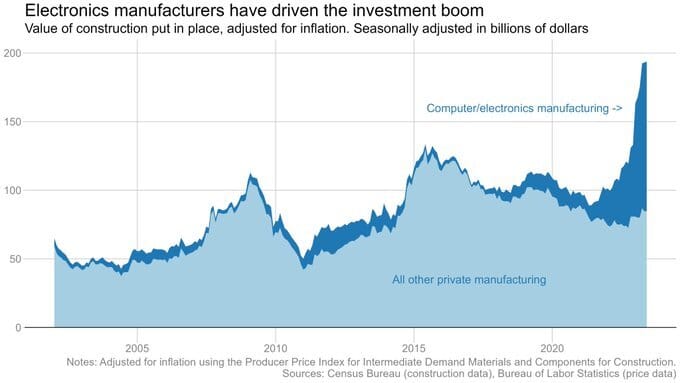
6. Construction spending (I). "Construction spending rose 0.5% vs 0.6% consensus."

7. Construction spending (II). "The boom is being driven by computer and electronics manufacturing, almost certainly driven (at least in part) by the CHIPS Act."
8. S&P Global US Manufacturing PMI. The index improved to 49 (in-line) from 46.3 in June for the third straight month of contraction.

9. ISM Manufacturing PMI (I). The index ticked higher to 46.4 (vs. 46.8 est) but remained in contraction for the 9th consecutive month.

10. ISM Manufacturing PMI (II). Under the hood, employment is slowing at the fastest rate since Covid lockdowns while prices and new orders continue to contract.

11. JOLTs (I). "US job openings fell in June to the lowest level since April 2021...Hiring fell to the lowest level since February 2021. But layoffs also declined to the lowest since the end of last year...The so-called quits rate...fell to 2.4%, matching the lowest since February 2021...The ratio of openings to unemployed people was little changed at 1.6 in June."

12. JOLTs (II). "Every major industry sector reported a layoff rate in June equal to or below its February 2020 level."

13. Dallas Fed Services. “Activity improved 4pts to -4.2 from -8.2. Driven by revenue (+9.3) and hours worked (+4.4). Prices declined, input (-3.3) and selling (-2.9). Employment was unchanged.”

14. Q3 GDP. GDPNow model estimate for Q3 GDP growth jumped to 3.9% from 3.5% on July 28. Contribution breakdown below.

15. Gas prices. "Gas prices up 5.1% in the last 8 days (or 18 cents)."

16. API crude draw. “API reports that Crude stocks fell 15.4mm barrels last week (yes 15.4!!!) - over 10x expectations…If that holds for the official data released tomorrow that will be the biggest weekly draw in the data's history (back to 1982).”

17. Dollar shorts. "Speculators are boosting their bets against the US dollar."

18. Central banks vs. gold. “Central bank gold buying in H1 reached a first-half record of 387t.”

19. Stocks vs. bonds. “I keep looking at this chart and asking myself...Who is lying? The answer is becoming increasingly evident. Treasuries are breaking a key support today and are likely headed much lower.”

20. Exposure plans. Just 28% of JPMorgan clients plan to increase equity exposure.

21. Mutual fund cash. Cash holdings for equity mutual funds have decreased from $240 billion to $191 billion YTD.

22. Retail paradox. "Single stock put call skew has imploded, indicating retail is very enthusiastic for leveraged upside exposure....but at the same time they have continued selling single stocks in great size."

23. Margin debt. "According to FINRA margin data, this is the largest 6-month increase in leverage on record...[and] leverage increased by ~$300B in the last 12 months."

24. De-grossing. "Last week’s de-grossing was fastest since 2021’s short squeeze."

25. Most short vs. mega cap. "The GS most short basket outperformed mega cap by 18.6% over the last month."

26. SPX vs. soft data. "Risk markets are overshooting what can be seen in the data."

27. Global breadth. "Nearly half the world made new 12-month highs in July. And for the first time since April 2021, no ACWI markets made new lows last month."

See:
28. August outflows. "August is the worst month of the year for flows. Maybe the most important point is that the inflows stop."

29. SPX seasonality. "Historically, August tends to be a weak month for the S&P 500 in the third year of the US presidential cycle."

30. SPX vs. history. And finally, “stocks continue one of their best years on record. With price-only S&P 500 data going back to 1927, this year ranks as the tenth best through July 31.”

Thanks for reading!
Reply