- Daily Chartbook
- Posts
- Daily Chartbook #234
Daily Chartbook #234
Catch up on the day in 29 charts
Welcome back to Daily Chartbook: the day’s best charts & insights, curated.
1. Home prices. "CoreLogic reaffirms its outlook of +4.5% U.S. home price growth over the next 12 months."

2. Office investment. "Data on office vacancy rates, which lead office investment, points to sharper declines ahead…We expect office investment to fall an additional 30% cumulatively by the end of 2024."

3. Excess savings. "At this rate this [excess savings] ‘nest egg’ will not be eliminated for another 9-10 months. However, we believe a major weakening of the labor market would change attitudes .. causing spendable ‘excess savings’ to become protected ‘precautionary savings'."

4. Fed balance sheet. "Worth noting that thru last week, spike in Fed's balance sheet (which coincided with banking stress earlier this year) has been completely undone ... total assets now at lowest since mid-2021."

5. Fed vs. FCI. "The GS Financial Conditions Index is back at levels first seen a year ago (when the Fed was still at a 3-handle), yet the terminal rate is now at 5.4%. If the Fed is trying to solve for tighter financial conditions, it is not being very successful."

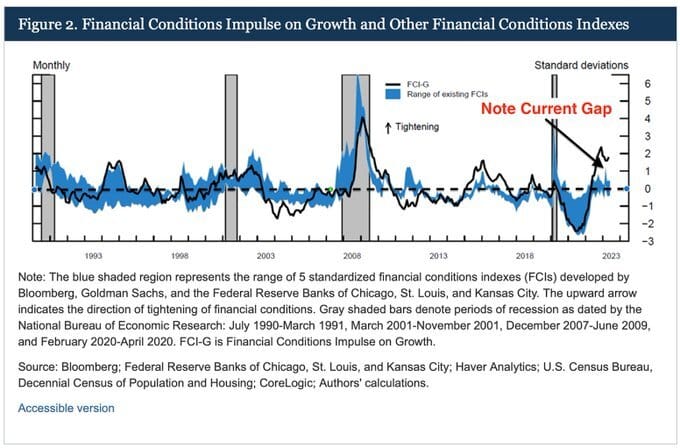
6. FCI-G. "The [Fed's] ‘home office’ in Washington has a new take on measuring financial conditions which is getting a lot of buzz. It shows current conditions are much tighter than other widely used measures."
7. PE dry powder. "Private equities have a record amount of dry powder."

8. NFIB Small Business Optimism. The "index had a very good mix in today's release. Lower pricing/inflation and job openings hard to fill (-2) versus increases in business outlook (+10). Headline index +1.6 to 91 (vs 89.9 est)."

9. Redbook. Redbook retail sales growth went negative (-0.4%) YoY for the first time since March 2020.

10. Online inflation. "Prices of goods sold online fell 2.6% in June from a year earlier...It was the biggest drop since May 2020, and the 10th straight month in which there’s been a year-on-year decline."

11. Inflation drivers. Labor "is now the most important contributor to inflation — which makes sense as it is in services, where costs are dominated by labor, that inflation is most problematic."

12. CPI Nowcast. "The Cleveland Fed’s Inflation nowcast suggests tomorrow’s CPI report will be in line w/ forecasts. We're watching monthly core inflation most closely, which at 0.4%/month is proving quite sticky. We’re not in 1970s territory, but nor are we anything close to the 1990s–2010s."

13. CPI implied move. "S&P options are currently implying a 1-day move of 50bps post the CPI release...This is roughly in line with an average realized move of 60bps YTD."

14. Stocks vs. bonds. "Fundamental and technical indicators point to bonds being attractive relative to stocks."

15. Bond positioning. "Bets against Treasury futures remain extreme (and profitable)."

16. Exposure plans (I). Only 11% of JPMorgan clients plan to decrease bond portfolio duration.

17. Exposure plans (II). Just 26% plan to increase equity exposure.

18. Investor flows. "Another big week for interest in risk assets … large-cap and broad equity ETFs collectively took in >$18 billion last week; fixed income ETFs had smaller inflows … for month of July, large- and mid-cap equity ETFs held largest share of inflows at nearly 55%."

19. Investor positioning. "The GS sentiment indicator remains stretched."

20. Retail participation. “The recent rally in equities saw a strong uptick in retail participation as single stock option activity almost doubled in Q2.”

21. CTA flows. “Over the next 1 week...Flat tape:-$9.5bn to sell [globally] (+$1.4bn SPX to buy); Up tape: $9bn to buy (-$226m SPX to sell); Down tape:-$43bn to sell (-$9.7bn SPX).”

22. Post retracement. "AFTER retracing 50% of bear market (4,800 to 3,500, up to 4,200)...historically the average MAX Downside️ is 6% and average MAX UPside is 20% from the signal date. Downside potential far more limited than upside potential."

23. SPX vs. VIX. "Over the last month, $VIX and $SPX have become best friends."

See:
24. SPX vs. macro. "More and more macroeconomic indicators are reversing to a bullish condition. After similar reversals, the S&P 500 was higher six months later in all but one case."

25. Econ Surprise vs. EPS beats. "Economic Surprise Index points to a big 8% EPS beat this quarter based on the historical relationship."

26. Q2 earnings. "Consensus expects earnings to fall 7.3% y/y but then trend higher. Notable is the implied margin expansion beginning in Q4 (earnings > revenue growth), investors will be looking for guidance from management teams to validate that."

27. Profit margins. The "pace of margin deterioration started decelerating."

28. SPX ATHs. "Going back to 1950, this is currently the 9th longest stretch without the S&P 500 making a new all-time high."

See:
29. Cyclicals breadth. And finally, “two of the most cyclical sectors -- Consumer Discretionary and Industrials -- have the two strongest cumulative A/D line readings.”

Thanks for reading!
Reply