- Daily Chartbook
- Posts
- Daily Chartbook #202
Daily Chartbook #202
Catch up on the day in 30 charts
Welcome back to Daily Chartbook: the day’s best charts & insights, curated.
1. Home prices. "The median U.S. home sale price fell 4.1% ($17,603) year over year in April to $408,031. That’s the biggest drop on record in dollar terms and the largest decline since January 2012 in percentage terms."

2. New listings. "New listings dropped 26.1% year over year on a seasonally adjusted basis in April...That’s the largest decline on record aside from April 2020."

3. Federal spending & revenue. Federal debt is on an unsustainable path.

See:
4. Treasury cash balance. "We estimate that Treasury’s cash balance will drop under $30bn by June 8-9."

5. Household wellbeing. According to a Fed survey of household wellbeing, "the share who said they were worse off financially than a year earlier rose to 35%, the highest since the question was first asked in 2014."

6. High-quality credit. "The interest coverage ratio for the investment grade index is currently near all-time high levels."

7. 2-year shorts. "Hedge funds extend net short 2-year Treasuries futures position to new record 853k contracts. Looks like a hefty wager on hawkish Fed and/or curve steepener trade."

8. VIX call options. "Traders are using call options to bet that the Cboe Volatility Index, or VIX, will rise at the fastest clip since March 2020."

9. Equity sentiment. "The GS 'Sentiment & Positioning' indicator is still negative....this is still a very 'under-owned' and hated rally."

10. Equity fund flows. Equity funds have seen outflows for 7 consecutive months, including ~$24 billion through the first 3 weeks of May.

11. Investor positioning. "Retail investors have reduced positions and institutional investors are currently favoring cash."

12. Equity positioning (I). "Nobody can afford to not chase the latest move higher. Note systematics are now running the biggest longs in a long time."

13. Equity positioning (II). DB's consolidated equity positioning indicator is back to neutral.

14. Nasdaq 100 positioning. Asset managers and levered funds are increasingly long Big Tech.

15. Short the S&P. "Large speculators/hedge funds have boosted net short S&P 500 futures positions even more, surpassing 2011 extreme and moving to 2007 territory."

16. But not the Nasdaq or DJI. "This supposed big short does not match positioning in the Nasdaq and the Dow Jones."

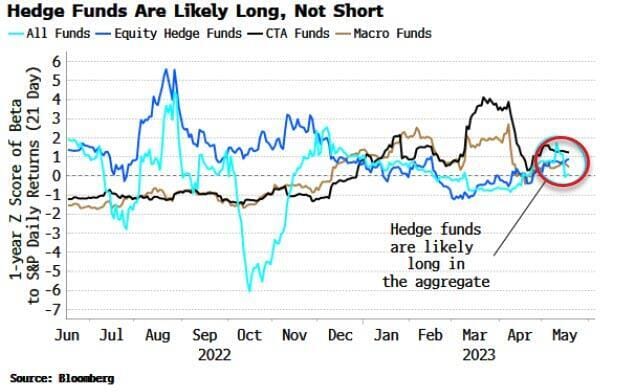
17. Hedge fund positioning. "Hedge funds in the aggregate - as well as macro funds, equity long-short and CTAs - are likely neutral to net long equities, not short."
18. Equal- vs. market cap-weight. "It has been 52 trading days since March 8, and the market cap has outperformed the equal-weight version by 7.52% (bottom panel). 3 other times has this spread been this wide: COVID collapse spring of 2020...GFC collapse in the fall of 2008...Tech mania in late 1999."

19. SPX target. "BofA RAISES 2023 S&P 500 target to 4,300 (from 4,000) 'based on five indicators yielding a range from 3900 (Fair Value) to 4600 (Sentiment)'."

See:
20. SPX breadth. "Here is the percentage of S&P 500 members outperforming the index."

21. SPX fwd PEG. "The S&P 500's fwd P/E/G (i.e. P/E adj for growth) is 1.92x, approaching mid-2020 levels. After that peak, earnings and growth expectations surged due to stimulus and reopening, bringing this ratio down. Not sure we can expect the same now...stocks look expensive by this metric."

22. NDQ fwd PE. "Since October low, NASDAQ 100’s forward P/E (blue) has jumped 33%, while forward EPS (orange) are down ~3% (but have improved over past few months)."

23. NDQ P/S. "The median price to sales ratio in the Nasdaq 100 has moved up to 5.4x, its highest level since last August. It bottomed at 4.2x last October, which was >50% lower than the peak valuation of 8.5x in November 2021."

24. Q1 earnings update (I). "78% of $SPX companies have beaten EPS estimates to date for Q1, which is above the 5-year average of 77% and above the 10-year average of 73%."

25. Q1 earnings update (II). "76% of $SPX companies have beaten revenue estimates to date for Q1, which is above the 5-year average of 69% and above the 10-year average of 63%."

26. Q1 earnings update (III). "$SPX is reporting a Y/Y earnings decline of -2.2% for Q1 2023, which is the 2nd straight quarter that the index is reporting a (Y/Y) decrease in earnings."

27. Q1 earnings update (IV). "$SPX is reporting Y/Y revenue growth of 4.1% for Q1 2023, which is the lowest revenue growth since Q4 2020 (3.2%)."

28. Revenue guidance. "Forward 3-month positive guidance for $SPX corporate revenues is at the highest level since 2021."

29. Bottom-up EPS estimates. "The Street is looking for 5 percent sequential growth in Q3 and 12.4 pct growth from current levels by Q2 2024. S&P earnings only grow by 1-2 percent sequentially during economic expansions."

30. 2023 EPS. And finally, EPS estimates have improved for the top 10 S&P 500 stocks but not for the bottom 490.

Thanks for reading!
Reply