- Daily Chartbook
- Posts
- Daily Chartbook #199
Daily Chartbook #199
Catch up on the day in 29 charts
Welcome back to Daily Chartbook: the day’s best charts & insights, curated.
1. US petroleum inventories. "Total US commercial petroleum inventories rose by 7.6 MMbbl last week, driven by a 5 MMbbl increase in crude stocks."

See:
2. Strategic Petroleum Reserves. "While the Biden admin proclaimed their intent to buy 3mm barrels to start refilling the SPR this week, they drained another 2.4mm barrels - the 7th straight weekly drain (draining 11.993mm barrels)."

3. US housing (I). "Housing starts [jumped] 2.2% MoM (-1.4% MoM exp but March's data was revised down massively from -0.8% to -4.5%) and permits fell 1.5% MoM (vs unch exp) but also a major revision (upward from -8.8% to -3.0%)."

4. US housing (II). "This leaves the total levels for starts and permits back at pre-COVID levels (despite rates being massively higher)."

5. US housing (III). "Combined, there are 1.675 million units under construction, just 35 thousand below the all-time record of 1.710 million set in October 2022."

See:
6. Travel spending. "Travel spending has moderated in recent months to - 1.5% MoM in April."

7. TSA checkpoint."TSA checkpoint numbers are returning to pre-pandemic growth."

8. Credit standards. "A survey of 67 banks in the Dallas Fed district carried out in early May shows that credit standards have tightened significantly since SVB collapsed, and bank credit conditions are now at 2020 levels, and the deterioration continues."

9. Creditworthiness. "US default risk perceptions so high that FAANG have lower CDS (credit default swaps) spreads."

10. National Financial Conditions. The NFCI "ticked down to –0.30 in the week ending May 12, suggesting financial conditions continued to loosen."

11. Business conditions. "While we're looking for worsening macro, the Business Conditions Composite Index (orange line) stabilized since March trough and has inflected higher. Since GFC, the BCI has never inflected higher w/o continued improvement above 50."

12. Recession punt. "The consensus forecast for at least a year running has been that we're three months away from a recession, and it just keeps getting pushed back and pushed back and pushed back."

13. Q2 GDP. "The GDPNow model estimate for real GDP growth (seasonally adjusted annual rate) in the second quarter of 2023 is 2.9 percent on May 17, up from 2.6 percent on May 16."

14. Copper contango. "Copper stays in contango, a bearish form of the term structure. When in contango, traders hold inventory and go short the futures to hedge in order to earn the carry in tue forward curve. This is another sign that market stays weak."

15. Global breadth vs. USD. "Dollar barely off its lows and % of global markets above their 50-day avg has dropped to its lowest level of Q2. Looks like US struggles are weighing on the world."

See:
16. MOVE vs. VIX. "Bond volatility (MOVE Index, blue) has eased from peak but has stayed in an elevated range, especially when compared to equity volatility (VIX Index, orange), which continues to trend lower."

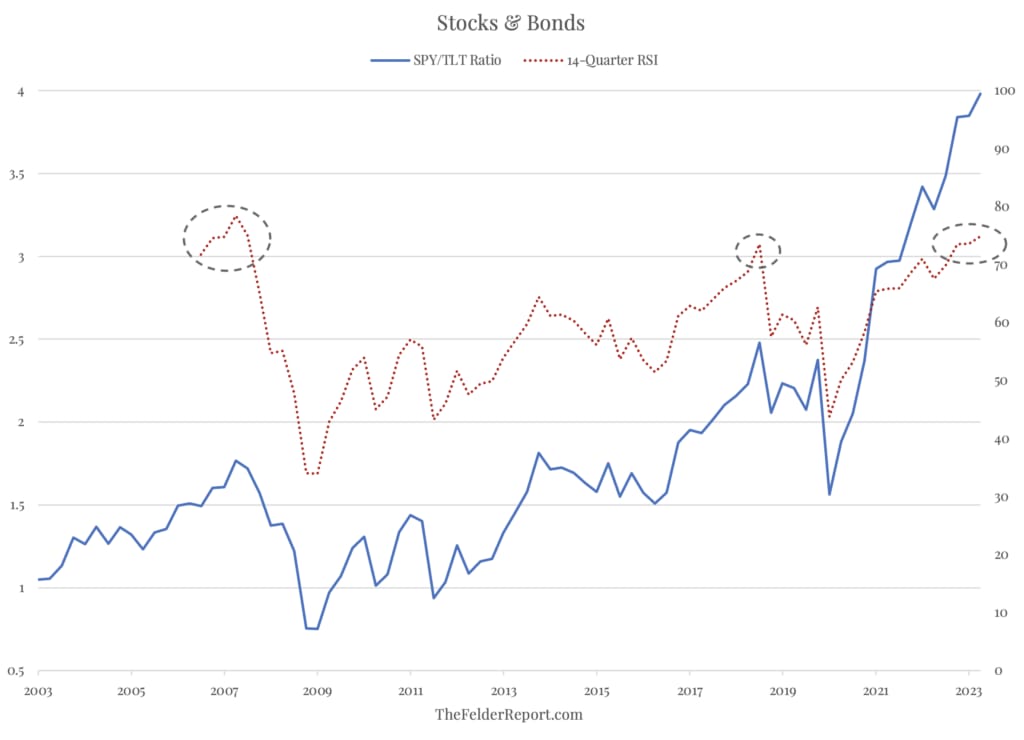
17. Stocks vs. bonds. “The SPY-to-TLT ratio has only been as overbought (as measured by quarterly RSI) as it is today at the 2007 top heading into the GFC.”
18. Sector downgrades. "Since beginning of 2022, downgrades from S&P and Moody's have been overwhelmingly concentrated in financial sector (particularly, banks at top of list) ... insurance firms have second and third most downgrades."

19. FMS investor positioning. Investors rotated out of commodities, utilities, and emerging markets, and into tech, Eurozone, and equities.

See:
20. SPX shorts. "S&P 500 short positions have been at some of the highest levels of the past 12 years but the index is up on the year."

21. Regional shorts. "Short interest as a percentage of shares outstanding in the SPDR S&P Regional Banking ETF (ticker KRE) rose to 92% from 74% a week ago."

22. Bull market checklist. "Our bull market signposts suggest the S&P 500 may not break out just yet: 50% are triggered vs. 80-90% ahead of prior S&P 500 market bottoms."

23. AI hype. "The AI boom and hype is strong. So strong that without the AI-popular stocks, S&P 500 would be down 2% this year. Not +8%."

24. Post-hike returns. "US stocks tend to outperform global peers after the last Fed hike."

25. Operating margin. "S&P 500’s forward 12m operating margin has started to roll over this month, but hasn’t yet cut below its recent April low."

26. Margin growth. "Our macro model supports the view that margins should stabilize in coming quarters."

27. Profit margins (I). "Profit margins declined by much less than feared in 1Q 2023."

28. Profit margins (II). "S&P 500 margins are back at pre-COVID levels and rose sequentially in 1Q 2023."

29. Profit margins (III). And finally, “profit margin expansion has accounted for 40% of the S&P 500 price gain since 1990.”

Thanks for reading!
Reply