- Daily Chartbook
- Posts
- Daily Chartbook #143
Daily Chartbook #143
Catch up on the day in 30 charts
Welcome back to Daily Chartbook: macro market charts, data, and insights pulled from various sources around the Internet by a solo retail investor.
1. Housing starts & building permits (I). Housing starts fell 4.5% in January (5th straight monthly decline, longest streak since 2009) while building permits ticked up 0.1%.

2. Housing starts & building permits (II). Single-family and multi-family starts decreased 27.3% and 8.1% YoY, respectively.

3. Housing starts & building permits (III). "Single-family permits drop to just 718K saar, lowest since May 2020".

4. Mortgage rates. "The average rate on the standard 30-year fixed mortgage rose to 6.32%, the biggest weekly jump since October".

5. Mortgage delinquencies. "Overall delinquencies increased in Q4 from a record low in Q3".

6. Loan standards. "Lending standards are tightening across the board - for both large and small firms. Higher rates create twice the pressure - loan interest payments go up; collateral valuations come down".

7. Household Debt & Credit (I). "Total household debt in the fourth quarter of 2022 rose by 2.4% or $394 billion, the largest nominal quarterly increase in twenty years, to a record $16.90 trillion".

8. Household Debt & Credit (II). "Aggregate limits on credit card accounts increased by $88 billion in the fourth quarter and now stand at $4.4 trillion".

9. Household Debt & Credit (III). "The share of current debt becoming delinquent increased again in the fourth quarter for nearly all debt types".

10. Surprise. "Citi's US economic surprises index is its highest since April last year. Unequivocally strong data, excessively gloomy forecasts, or a bit of both?".

11. Jobless claims. "Initial claims remained below 200,000 at 195,000, while the 4 week average increased very slightly to 189,500. Continuing claims increased to 1,696,000, the third highest number in over a year".

12. Temps vs payroll change. "Not really buying the whole ‘warm January’ theory to explain this last strong payrolls number. Pretty weak relationship here historically to the January temperature anomaly".

13. PPI (I). "PPI came in hotter than expected, up 0.7% MoM, which pushed the YoY rise to +6.0% (down from +6.5% in December). That is the biggest MoM jump in the headline since June 2022, but lowest YoY print since March 2021".

14. PPI (II). Under the hood - "in short, it's not decelerating as fast as people hoped".
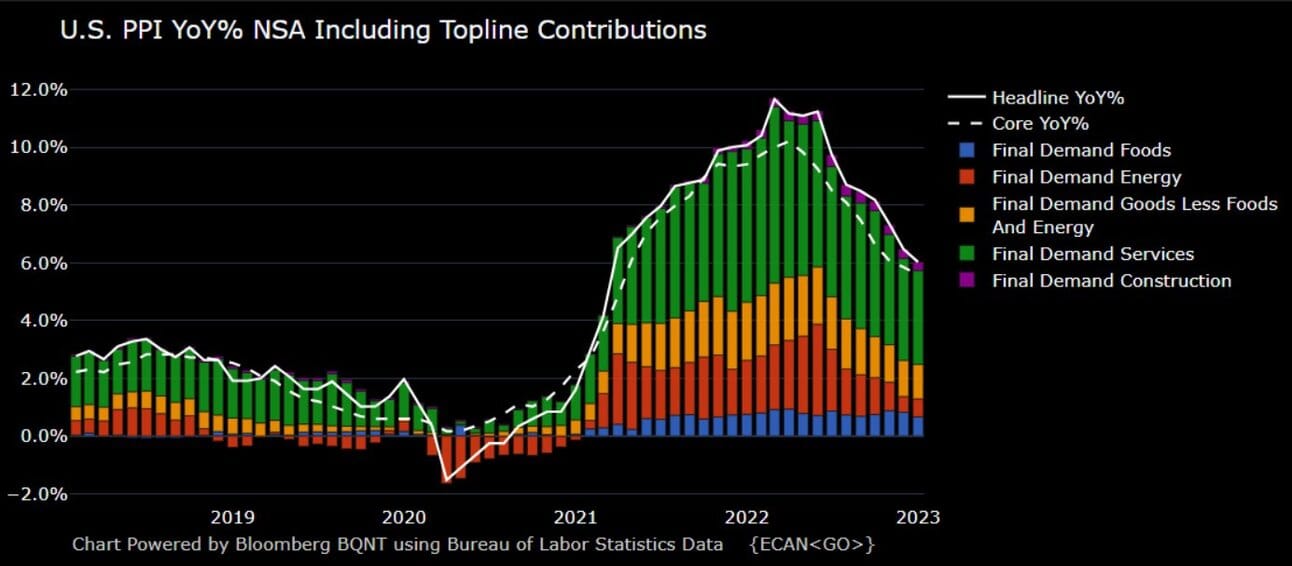
15. PPI (III). "The positive news is that the pipeline for inflation looks like it’s continuing to decline with intermediate demand inflation down to +4.71% YoY".

16. Philly manufacturing. "Philly Fed was a disaster, coming in at -24.3 vs -7.6 expectations. Last reading was -8.9. New orders index remained negative (!!!). Employment index declined, but remained positive. Expectations are tempered for growth over next six month period".

17. Q1 GDP. Atlanta Fed's GDPNow model nowcast for Q1 moved up to 2.5% from 2.4%.

18. Profit margins (I). "Profit numbers – like so many pandemic datasets — are in more-or-less uncharted territory, still near multi-decade highs".

19. Profit margins (II). However, record profit margins are narrowing.

20. Profit margins vs. employment. "Share of companies saying their profit margins narrowed in the last quarter was the highest in almost three years…for the first time in at least two years, more respondents said they expect payrolls to fall over the coming three months than to rise".

21. Brent-WTI spread. "The premium of Europe's Brent crude oil to U.S. standard WTI has more than doubled to over $6 per barrel since the start of the year. Six dollars is sometimes cited by analysts as a critical level beyond which U.S. barrels begin flowing overseas".

22. USD decline. "Our new model of exchange-rate drivers suggests expectations of a less hawkish Fed and more risk appetite from investors are the main drivers" behind the USD's drop since early November.

23. Maturity wall. "With $6.3 trillion of outstanding corporate bonds alone coming due by the end of 2025, many companies are seeking alternative ways to protect their balance sheets".

24. Rapid repricing. "The bond market has gone from being much more dovish than the Fed in end January, to now expecting a higher terminal rate than the Fed's median dot for 2023. Note there are still cuts priced into the 2H23, but much less (~20 bps vs. ~50 bps in Jan)".

25. NDX vs. US02Y. "There is a historical non-correlation between the Nasdaq and 2-Year Treasury yields. (Rising rates impact discount rate of earnings). The recent surge in tech stocks have ignored rising yeilds....for now".

26. Active money managers. NAAIM exposure ticked down.

27. AAI sentiment. "2nd week in a row with more bulls than bears on the AAII survey. While last year's pessimism was not more intense than what was seen in 2008-09, it was more persistent".

28. Rotation. "Fund managers have been rotating into cyclical".

29. Tech positioning. "Despite the recent buying activity, net positioning in Info Tech remains relatively low. Aggregate US Info Tech long/short ratio now stands at 2.2 in the 9th percentile vs. the past 5 years".

30. Tech short-covering. And finally, “the short covering in US Tech stocks from Jan 31st to Feb 15th is the second largest in magnitude over any 12-day period in the past decade and ranks in the 99.5th percentile”.

Thanks for reading!
Reply