- Daily Chartbook
- Posts
- Daily Chartbook #137
Daily Chartbook #137
Catch up on the day in 27 charts
Welcome back to Daily Chartbook: macro market charts, data, and insights pulled from various sources around the Internet by a solo retail investor.
1. EIA stocks change. "EIA data showed a bigger than expected crude inventory build (the 7th weekly build in a row) and in fact saw builds across the board (with gasoline stopcks soaring)".

2. US inventories. US petroleum inventory levels.

3. Mortgage demand. "U.S. home purchase mortgage applications are stabilizing in early 2023, though still down over 30% from a year ago".

4. Egg prices. "Wholesale prices for a dozen eggs in the US have moved down to $2.61, a 52% decline from their peak of $5.43 in December".

5. Container rates. "The shipping market has normalized after two years of exceptionally high freight rates".

6. Inbound freight. "Container imports bound for the US are below pre-covid levels".

7. US trucking. "Tender rejections, a way to measure available trucking capacity, have reached a non-covid low, as trucking companies struggle to keep their trucks loaded. This is deflationary for freight rates".

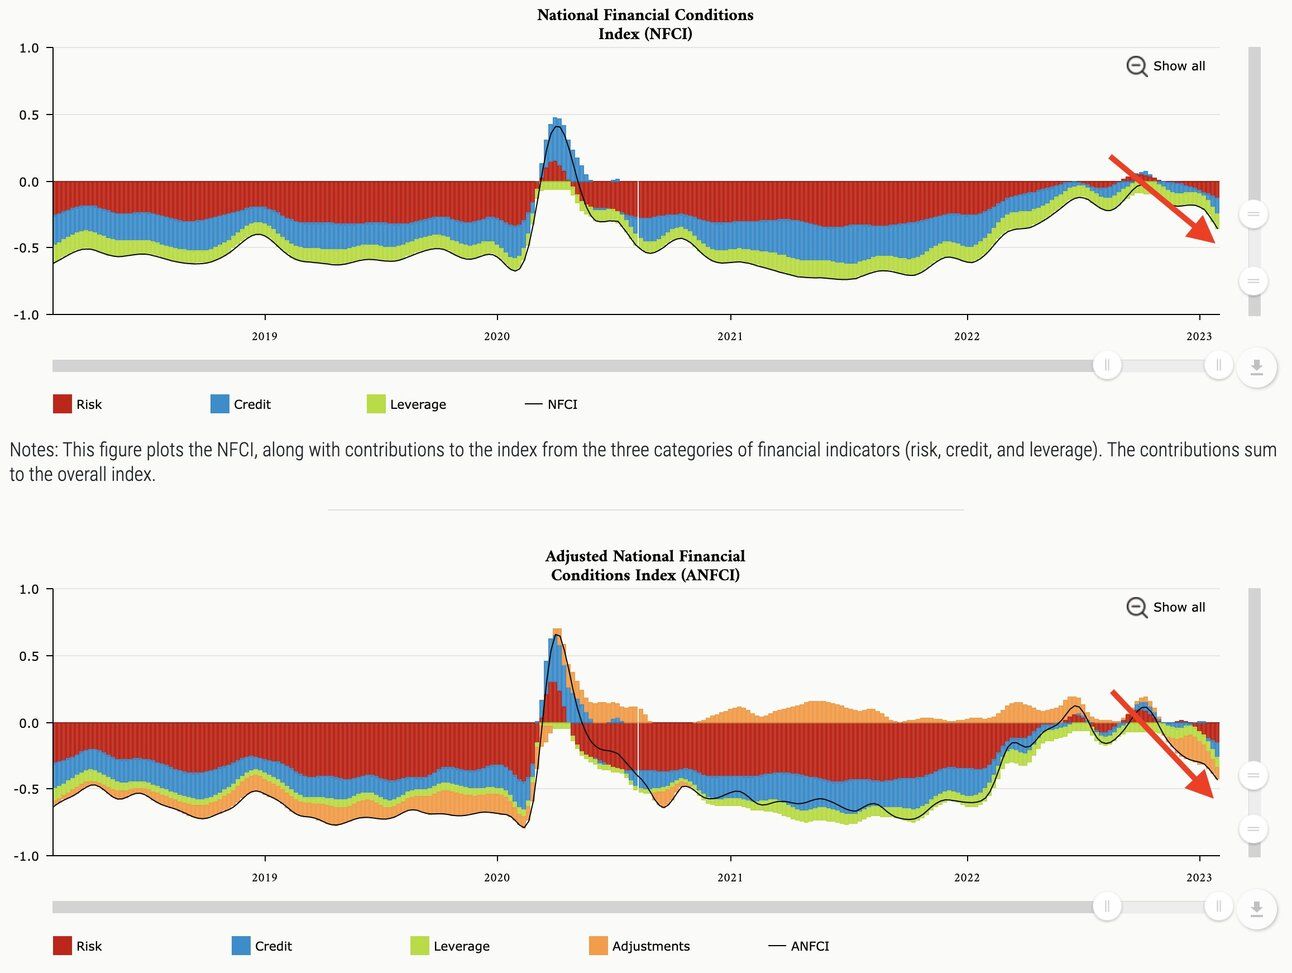
8. NFCI. "The National Financial Conditions Index has loosened since Oct'22, lower than it was when the Fed hiked in Mar'22".
9. Tightening credit (I). "The only time conditions have tightened this much has been in advance of or during the last 4 recessions since 1990".

10. Tightening credit (II). "The Fed Funds rate peaks, then several quarters pass before loan officers fully retrench...Tighter conditions well into 2024, maybe 2025".

11. Credit card debt. Despite reaching a record $930 billion, credit card debt as a percental of total household assets is below the average of the 2010s at ~0.6%.

12. Fed funds rate expectations. "What a difference a month makes ... market has rapidly adjusted its expectations for fed funds rate, in line (for now) with what Fed is expecting in terms of terminal rate (market’s expectation for cuts is a different story)".

13. Fed liquidity warning. "This model has been closely tracking $SPX since mid-2020 & has done a reasonably good job of highlighting previous bear market rallies. With the current divergence in mind, our caution against this rally reiterated".

14. Gold flows. "The latest #gold fundflow data of physically backed gold funds shows mixed information. Since May of 2022, we see basically monthly outflows— nevertheless, they become less and less from month to month and therefore help to keep this really going".

15. Banks bond hit. "Banks took the biggest hit to their bond portfolios last year since 2008".

16. Tech stocks vs. bond market. "Bond market talks recession (yield curve still deeply inverted) while NASDAQ forward earning valuations decide to go after the moon - zero fear of inflation".

17. Global risk demand. "Global risk appetite is back to levels that tends to market short-term market peaks".

18. Risk assets cycles. "Risk assets attempting to turn corner to new bullish cycle...average current cycle length for risk assets is 18 trading days in bearish direction (low point of was 11/10/2022); components have been improving since".

19. Foreign flows. "After record outflows, foreign investment is slowly returning to the U.S. stock market ".

20. Confidence spread. "Smart money/dumb money confidence is at extremely low levels".

21. Insiders. Corporate insiders have sold heavily into this rally.

22. Smart-beta flows. "Quant ETFs shed billions as risk appetite returns and market trends reverse. Most of those strategies had record returns and inflows in 2022".

23. Conditions vs. revisions. Loosening financial conditions "could actually help earnings revisions".

24. Q4 earnings. "Analysts have lowered Q1 S&P 500 EPS estimates by 3.1%. Consensus appears to be too high for a slow economy, fanciful for a recession".

25. Profit margins. "Q4 margins were less than stellar relative to expectations".

26. NDX vs. SPX earnings. "Earnings growth for the tech-heavy Nasdaq-100 has lagged the S&P 500 for five quarters".

27. SPX breadth. And finally, “60% of S&P 500 stocks already have 50d avg> 200d avg. Among mid-caps (S&P 400), it's more than two-thirds (and the most since Sep 2021)”.

Thanks for reading!
Reply