- Daily Chartbook
- Posts
- Daily Chartbook #133
Daily Chartbook #133
Catch up on the day in 28 charts
Welcome back to Daily Chartbook: macro market charts, data, and insights pulled from various sources around the Internet by a solo retail investor.
1. Oil demand projections. "Who is right, BP or Exxon?"

2. Mortgage rates. "Mortgage rates under 6% for the first time since Sept. 12".

3. Autos. "Strong bounce for U.S. auto sales in January, up to 15.74M (annualized) vs. 15.5M est. & 13.31M prior … brings level to highest since May 2021".

4. Staff numbers talk. "'Headcount’ mentions by executives on earnings and other calls reached highest level last year since GFC per data collected by Bloomberg … tech firms used word most, followed by industrials".

5. Challenger cuts. "US employers in January announced the most job cuts since 2020".

6. Jobless claims. "Initial jobless claims last week declined -3,000 to 183,000, and the 4 week moving average declined -5,750 to 191,750. Both of these are close to their multi-decade lows from last March. Continuing claims also declined -11,000 to 1,655,000".

7. Productivity and unit labor costs. "Despite a strong advance in Q4, productivity remains depressed, down 1.5% y/y, which is exacerbating the compensation pressures & pushing up unit labor costs, up 4.5% y/y".

8. Factory orders. "December factory orders +1.8% m/m vs. +2.3% est. & -1.9% prior … orders ex-transportation (orange) -1.2% vs. +0.2% est. & -1.2% prior (rev down from -0.8%)".

9. Fed day. "Yesterday, the S&P 500 closed at the second-most overbought reading on the day of a Fed meeting under Powell's tenure".

10. Yields vs. Fed. "Markets dissented from Powell's hawkish FOMC message. Bloomberg Economics' model shows expectations of a more dovish Fed driving the fall in yields".

11. Reverse repo vs. S&P. "Big drop in the Reverse Repo has coincided with the S&P 500 rally this year".

12. Commodity funds. "Net flows equaled $-1,33 billion in January. Historically, we are at very pessimistic levels—looking at the 6-month rolling aggregate".

13. Crypto greed. "The Crypto Fear & Greed Index broke out into 'greed' territory for the first time since March 2022".

14. Short covering. "This month’s notional short covering in Single Stocks is the largest since Jan ’21 and ranks in the 98th percentile vs. the past 5 years, driven mainly by covering in large cap names".

15. Retail army. "Retail trading orders, as a percentage of volume, have surpassed the 2021 meme-mania peak".

16. Speaking of mania. "New high score...Total call volume today".

17. Hedge funds (I). "Gross leverage for all hedge funds up a whopping 13% in January to 240% which is a 12-month high...Net leverage still 'only' at 39%-tile (1 year look-back) and long/short ratio a single digit percentile".

18. Hedge funds (II). "Long/short ratio for all hedge funds at 8%-tile".

19. NAAIM. Active investment manager "exposure ticks up slightly to 78. Highest since April".

20. Buybacks. Corporate buybacks accelerated.

21. Dividend changes. "721 dividends have been announced. Of those, only 6% announced decreases, 29% are increases, and a far larger portion remain unchanged at 66%".

22. Expected returns. "US equity expected returns are currently lower than both treasuries and cash (and much lower vs global equity peers)".

23. Earnings & margins. "Corporate earnings are now contracting, a trend that could continue throughout 2023. Profit margins are eroding and have now declined from 13.7% to 12.0%".

24. NDX vs SPX. "Nasdaq 100 earnings have been lagging S&P 500 earnings for 15 months". Chart shows Nasdaq 100 2022 earnings as a percentage of S&P 500 2022 earnings.

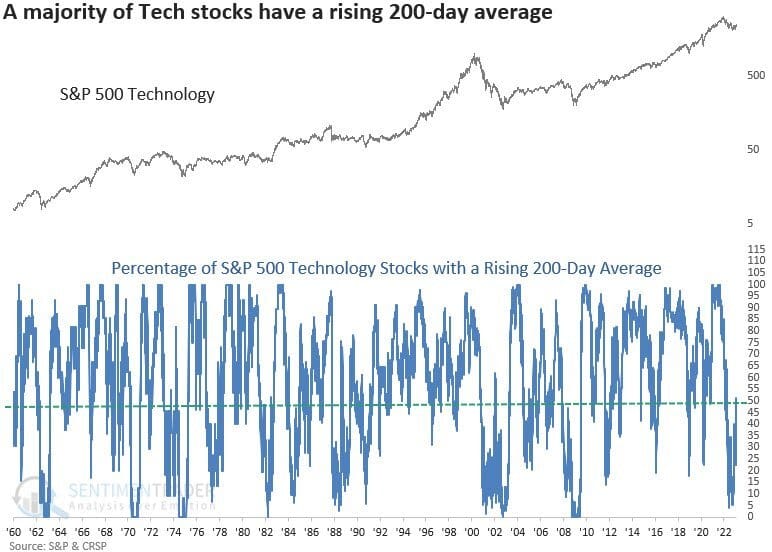
25. SPX vs. SPX Tech. "Did you know that the S&P 500 Technology sector has more stocks with a rising 200-day average than the S&P 500? 51.32% versus 43.91%".

26. NDX breadth. "Despite the surge to start the year, at the moment, ‘only’ 65% of $NDX constituents are trading above their 200-dma (.. for the broader S&P, that number is ~75%..)".

27. Sector breadth. "The number of sectors trading above their 200-day moving averages has gone from zero in September to ten as of yesterday. All prior zero-to-ten cases since 1973 are marked on the chart and have generally been good buying opportunities".

28. Golden cross. "What is special about this one is when it happens more than 10% away from all-time highs (like now) = future returns are impressive. Higher a yr later 15/16 and up 15.7% on avg".

Thanks for reading!
Reply